 Facebook
 Twitter
 Pinterest
 Copy Link
Kicks for Kids Shoe Drive August 8-19

Help us give kids the confidence they need to start the school year right! Windermere Mercer Island invites you to participate in our Kicks for Kids back-to-school sneaker drive. It connects low-income youth in our local communities with new shoes for the upcoming school year. Between August 8th and 19th, we’ll be accepting donations two ways:
-
Bring new or gently used sneakers (toddler/youth sizes) to my office at 2737 77th Ave SE, Ste. 100, Mercer Island. We’ll enter your name into a raffle for a delectable prize from Island Treats, and we’ll also match the first 100 pairs of shoes donated!
-
Shop from our Amazon Wishlist.

This year, we’re partnering once again with the Eastside Baby Corner, an amazing organization that helps kids thrive by providing resources and essentials with their 70+ partner agencies—many of which are school districts.
Help us make sure every child has a new pair of shoes for school!


We earn the trust and loyalty of our brokers and clients by doing real estate exceptionally well. The leader in our market, we deliver client-focused service in an authentic, collaborative, and transparent manner and with the unmatched knowledge and expertise that comes from decades of experience.
2737 77th Ave SE, Mercer Island, WA 98040 | (206) 232-0446
mercerisland@windermere.com
© Copyright 2022 Windermere Mercer Island
How’s the Market? Q2 Real Estate Review

While Seattle and the Eastside are still considered a seller’s market, buyers experienced some much-needed relief in the second quarter with new listings outpacing the number of homes sold. Rising interest rates have initiated a shift toward a more balanced market. Opportunities abound for both sellers (who are still seeing higher sales prices than this time last year) and buyers (who finally have some breathing room to negotiate price and contingencies). We expect this shift to continue with a stabilization of home prices rather than the steep upward trajectory we saw last year.
Click or scroll down to find your area report:
Seattle | Eastside | Mercer Island | Condos | Waterfront
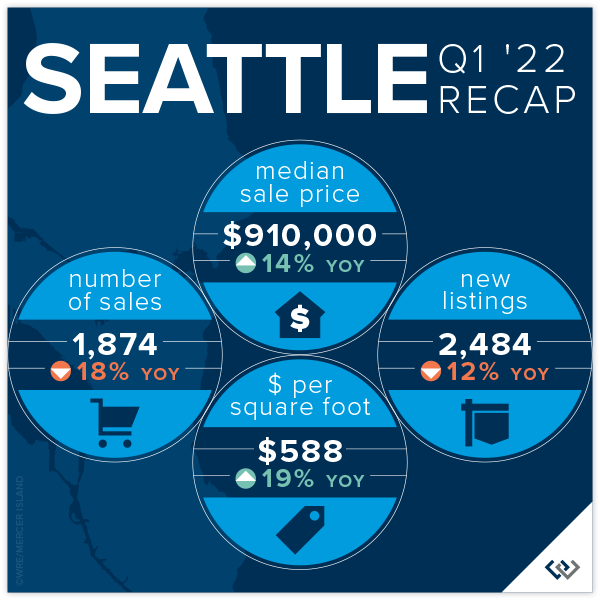
SEATTLE
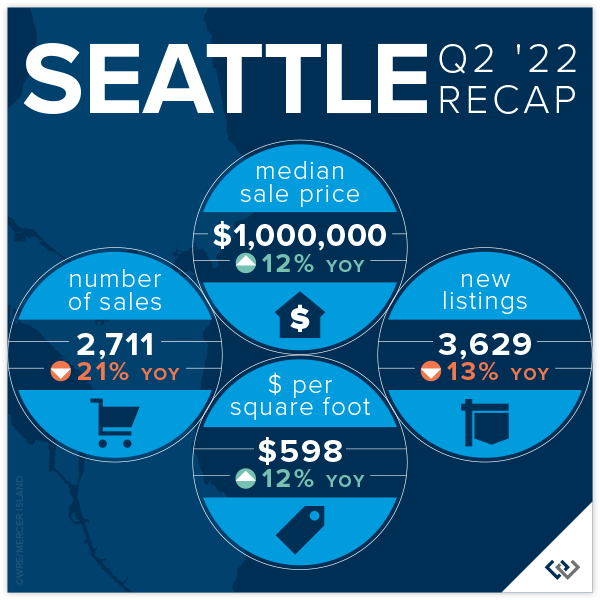
The Seattle real estate market for single family homes is holding steady despite rising interest rates and slowdowns elsewhere in King County! The median sale price is up 9% since the end of 2021 (from $910,000 to $1,000,000). Year over year, the median price rose from $895,000 in Q2 2021 to $1,000,000 in Q2 2022 (also roughly 12%).
Anecdotally, we believe that Seattle continues to gain ground because it remains affordable when compared to the cities and neighborhoods to the east. Eastside median prices rose so sharply over the last two years that it left Seattle “in the dust” as the market leader of the region. As we know, slow and steady wins the race, though there is no way to know yet if this particular race is a marathon or a sprint.
Interest rates nearly doubled in Q2, though that seems to leave Seattle home shoppers undeterred. 86% of the sales in Q2 sold in the first 10 days at an average of 110% of list price.
Click here for the full report and neighborhood-by-neighborhood statistics!
EASTSIDE
Relief has finally come to home shoppers on the Eastside! New listings are up 13% year over year. Further, there has been a slide in total number of sales, down 18% year over year. This means there are more choices for anyone who is in the market to buy a home. Price gains remain steady for now, up 22% over Q2 of 2021. This is likely riding the wave of growth in late 2021 and early 2022, but with the higher supply and lower demand this is may be a trend that tapers off in the near future.
Average price per square foot saw its first quarterly drop since Q2 of 2019, down from $713 in Q1 to $685. The overall median price fell from a high of $1,625,000 in Q1 to $1,610,000 in Q2. Even more exciting for home buyers is that (when in competition) the list to sales price ratio is 109%— down from 119% in Q1.
If you’ve thought about selling your home, it’s still a great time. When a home is prepared well and priced right shoppers pay attention. Of the 2177 homes sold in Q2, 84% of those sold in the first 10 days. This isn’t far off of the 90% that was posted in Q1. It is harder to get noticed today than in recent memory—this is where choosing a true professional to partner with is so important! Windermere brokers have their fingers on the pulse and know how to make you stand out in a crowd!

Click here for the full report and neighborhood-by-neighborhood statistics!

MERCER ISLAND
Mercer Island continues to be a fabulous place to be a homeowner. Median prices and price per square foot both saw increases over Q1 2022 numbers (6.5% and 5% respectively). Anecdotally, there has been a pace change. We don’t expect that to reflect in the stats until Q3, and even then the numbers are likely to be favorable as we gained so much ground in Q1 of this year.
The data that supports what we’re all feeling can be found in the relationship between number of new listings and number of homes sold. In Q2, there were 116 new listings and 84 sales compared to the same period in 2021 when we had 124 new listings and 102 sales. So, if you’re feeling like inventory is “up,” it’s not because more homeowners are deciding to sell but rather it appears that demand is down. Another way to look at this is that we sold 82% of the active inventory in spring of 2021 but only 72% in 2022. These are healthy numbers but it’s enough of a drop for us to feel it.
If you’re a buyer trying to break in to the Mercer Island market, it’s getting easier. 83% of the 116 new listings sold within the first 10 days for an average of 111% of the asking price. This is the most favorable these numbers have been since 2019. Working with a local pro will be your biggest advantage to determine which homes will sell at a premium and how to get the best deal!

Click here for the full report and neighborhood-by-neighborhood statistics!
CONDOS – SEATTLE & EASTSIDE
Condo average prices have seen their biggest quarterly rise since Q3 of 2016! As home shoppers adjust expectations amidst rising interest rates, the affordability offered by condos is an exciting place to turn. We are thrilled to see condos be a viable option as we recover from the pandemic and buyers return to more densely populated areas.
North Seattle (up 34%) and Capitol Hill (up 10%) are bright spots in the total number of condos sold year over year for Seattle. This makes perfect sense as both areas offer access to our growing light rail system and new retail opportunities that didn’t exist pre-pandemic. Seattle’s total sales year over year remained flat, literally zero, which means these two neighborhoods carried the entire city.
The same data point on the Eastside saw the entire area’s total number of sales fall 27% year over year. West Bellevue (down 51%) and Mercer Island (down 38%) topped the list. Meanwhile, prices on the Eastside are up an average of 20%.
Check out area-by-area details the full condo report.
WATERFRONT
Waterfront season is heating up. As expected, inventory is up from Q1 (32 total sales in Q2 v 17 in Q1), but what hasn’t changed is an average of only 6 listings for sale at any one time across all shorelines! Of all of the waterfront shorelines, Mercer Island boasted the lowest days on market with an average of just THREE days. Seattle had the highest days on market, with an average of 41 days.
The most affordable place to buy waterfront this quarter was Beach Dr in West Seattle at a closed sale price of $1,800,000 for 25’ of waterfront on a 17,000 sq. ft. lot. The largest piece of shoreline overall was 177 feet in Issaquah on Lake Sammamish, which commanded a sales price of $11,600,000.
This brief overview of the entire Seattle-Eastside private waterfront market, including Mercer Island and Lake Sammamish, illustrates the trends occurring in our region over time. This data is interesting and insightful but cannot replace an in-depth waterfront analysis provided by a savvy broker with years of local waterfront experience.
We earn the trust and loyalty of our brokers and clients by doing real estate exceptionally well. The leader in our market, we deliver client-focused service in an authentic, collaborative, and transparent manner and with the unmatched knowledge and expertise that comes from decades of experience.
© Copyright 2022, Windermere Real Estate/Mercer Island. Information and statistics derived from Northwest Multiple Listing Service and deemed accurate but not guaranteed.
Seattle & Eastside Farmers Markets: Locations, Times & More

Summer is just around the corner, and so are these farmers markets! Spend an evening or weekend finding your new favorites among the tents. Think it’s all about kale? Think again. Most offer live entertainment along with a mouth-watering variety of local brews, cheese, bread, meat/seafood, honey, hand roasted coffee, and other hidden gems (in addition to the freshly picked fruits & veggies). This year, we’re proud to sponsor the Mercer Island Farmers Market for its 15th season!
Seattle Metro
- Ballard
- Capitol Hill (Broadway)
- Columbia City
- Lake City
- Lake Forest Park
- Madrona
- Magnolia
- Phinney
- Pike Place
- Queen Anne
- Shoreline
- U-District
- Wallingford
- West Seattle
Greater Eastside
- Bellevue – Crossroads
- Bellevue – Downtown
- Carnation
- Duvall
- Issaquah
- Kirkland – Downtown
- Kirkland – Juanita
- Mercer Island (Sponsored by Windermere MI!)
- North Bend
- Redmond
- Renton
- Sammamish
- Woodinville

Seattle Metro
Ballard
Seattle’s first year-round Farmers Market, selling produce exclusively from Washington state farmers along the historic cobblestone stretch of Ballard Ave.
Sundays, 9am – 2pm | Year-Round
5345 Ballard Ave NW | Seattle
sfmamarkets.com/visit-ballard-farmers-market/
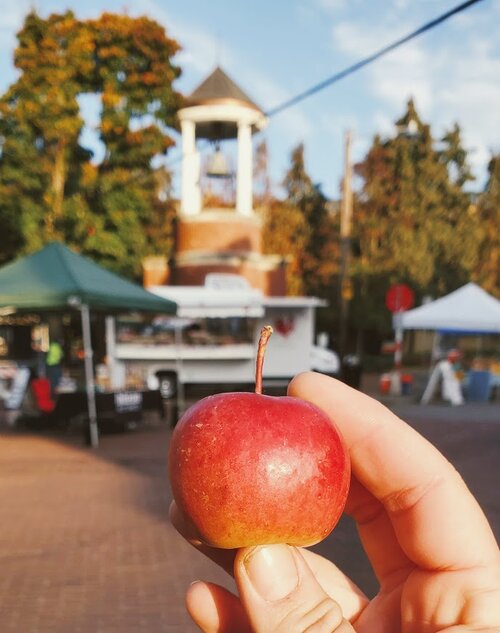
Photo courtesy of sfmamarkets.com
Capitol Hill (Broadway)
Come for Sunday brunch from food vendors who source ingredients from local, WA state farms (many of whom you’ll also meet selling their wares at the market). Live music and street performers often make an appearance, too.
Sundays, 11am – 3pm | Year-Round
E Barbara Bailey Way | Seattle
seattlefarmersmarkets.org/chfm
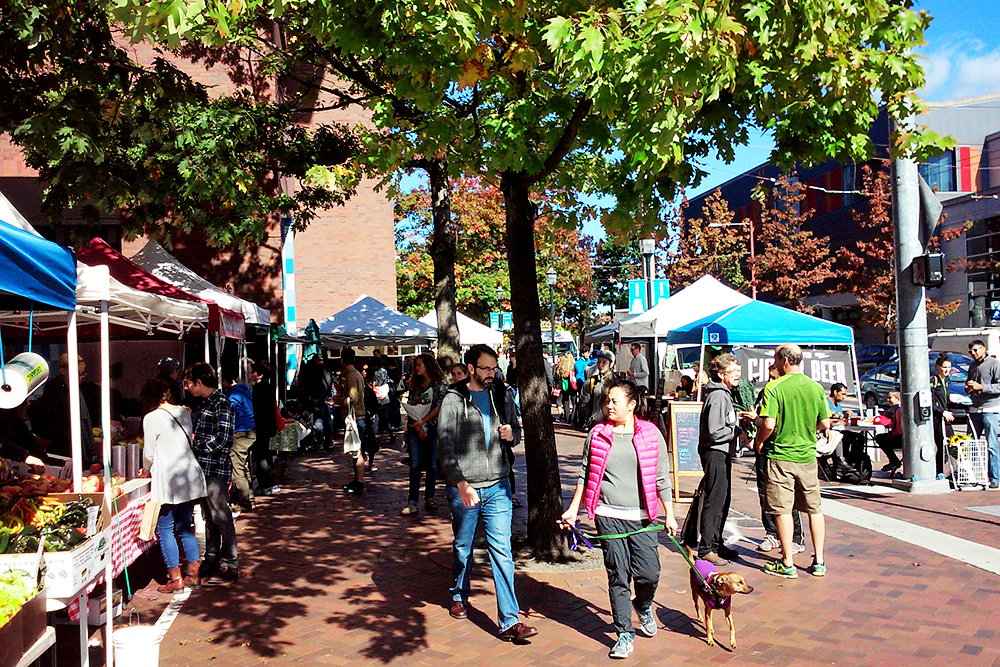
Photo courtesy of do206.com
Columbia City
With everything from freshly harvested Asian greens to Ethiopian eats, come check out the immense variety King County’s most diverse zip code has to offer. Bring your bounty to adjacent Columbia Park for a picnic.
Wednesdays, 3pm – 7pm | May 4 – Oct 12, 2022
37th Ave S | Seattle
seattlefarmersmarkets.org/ccfm
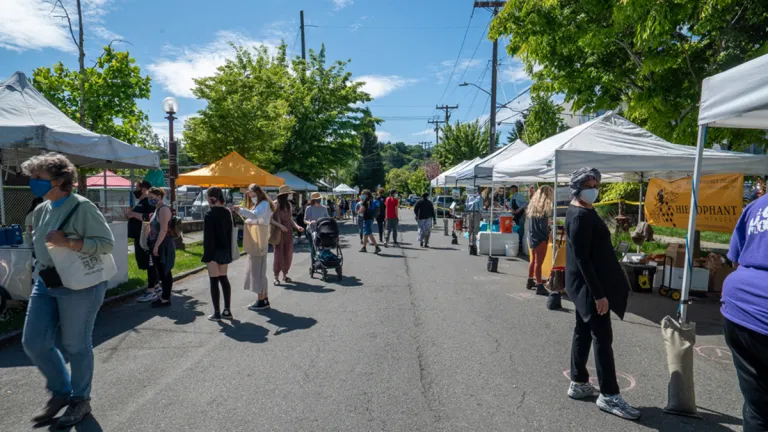
Photo courtesy of SouthSeattleEmerald.com
Lake City
This celebrated North End seasonal market offers unique finds grown and prepared by local farms and food artisans. Enjoy kids’ activities, too!
Thursdays, 3pm – 7pm | June 16 – Oct 6, 2022
NE 125th St & 28th Ave NE | Seattle
seattlefarmersmarkets.org/lcfm
Photo courtesy of enjoylakecity.org
Lake Forest Park
With an emphasis on fresh, locally grown food, this market is an epicurean’s delight. Browse hard cider, baked goods, preserves, meat, pasta, sauces, and prepared foods along with the locally harvested fruits and veggies. There is also one “Crafts Market” each summer featuring local artisans.
Sundays, 10am – 2pm | May 8 – Oct 16, 2022
17171 Bothell Way NE | Lake Forest Park
www.thirdplacecommons.org/farmers-market
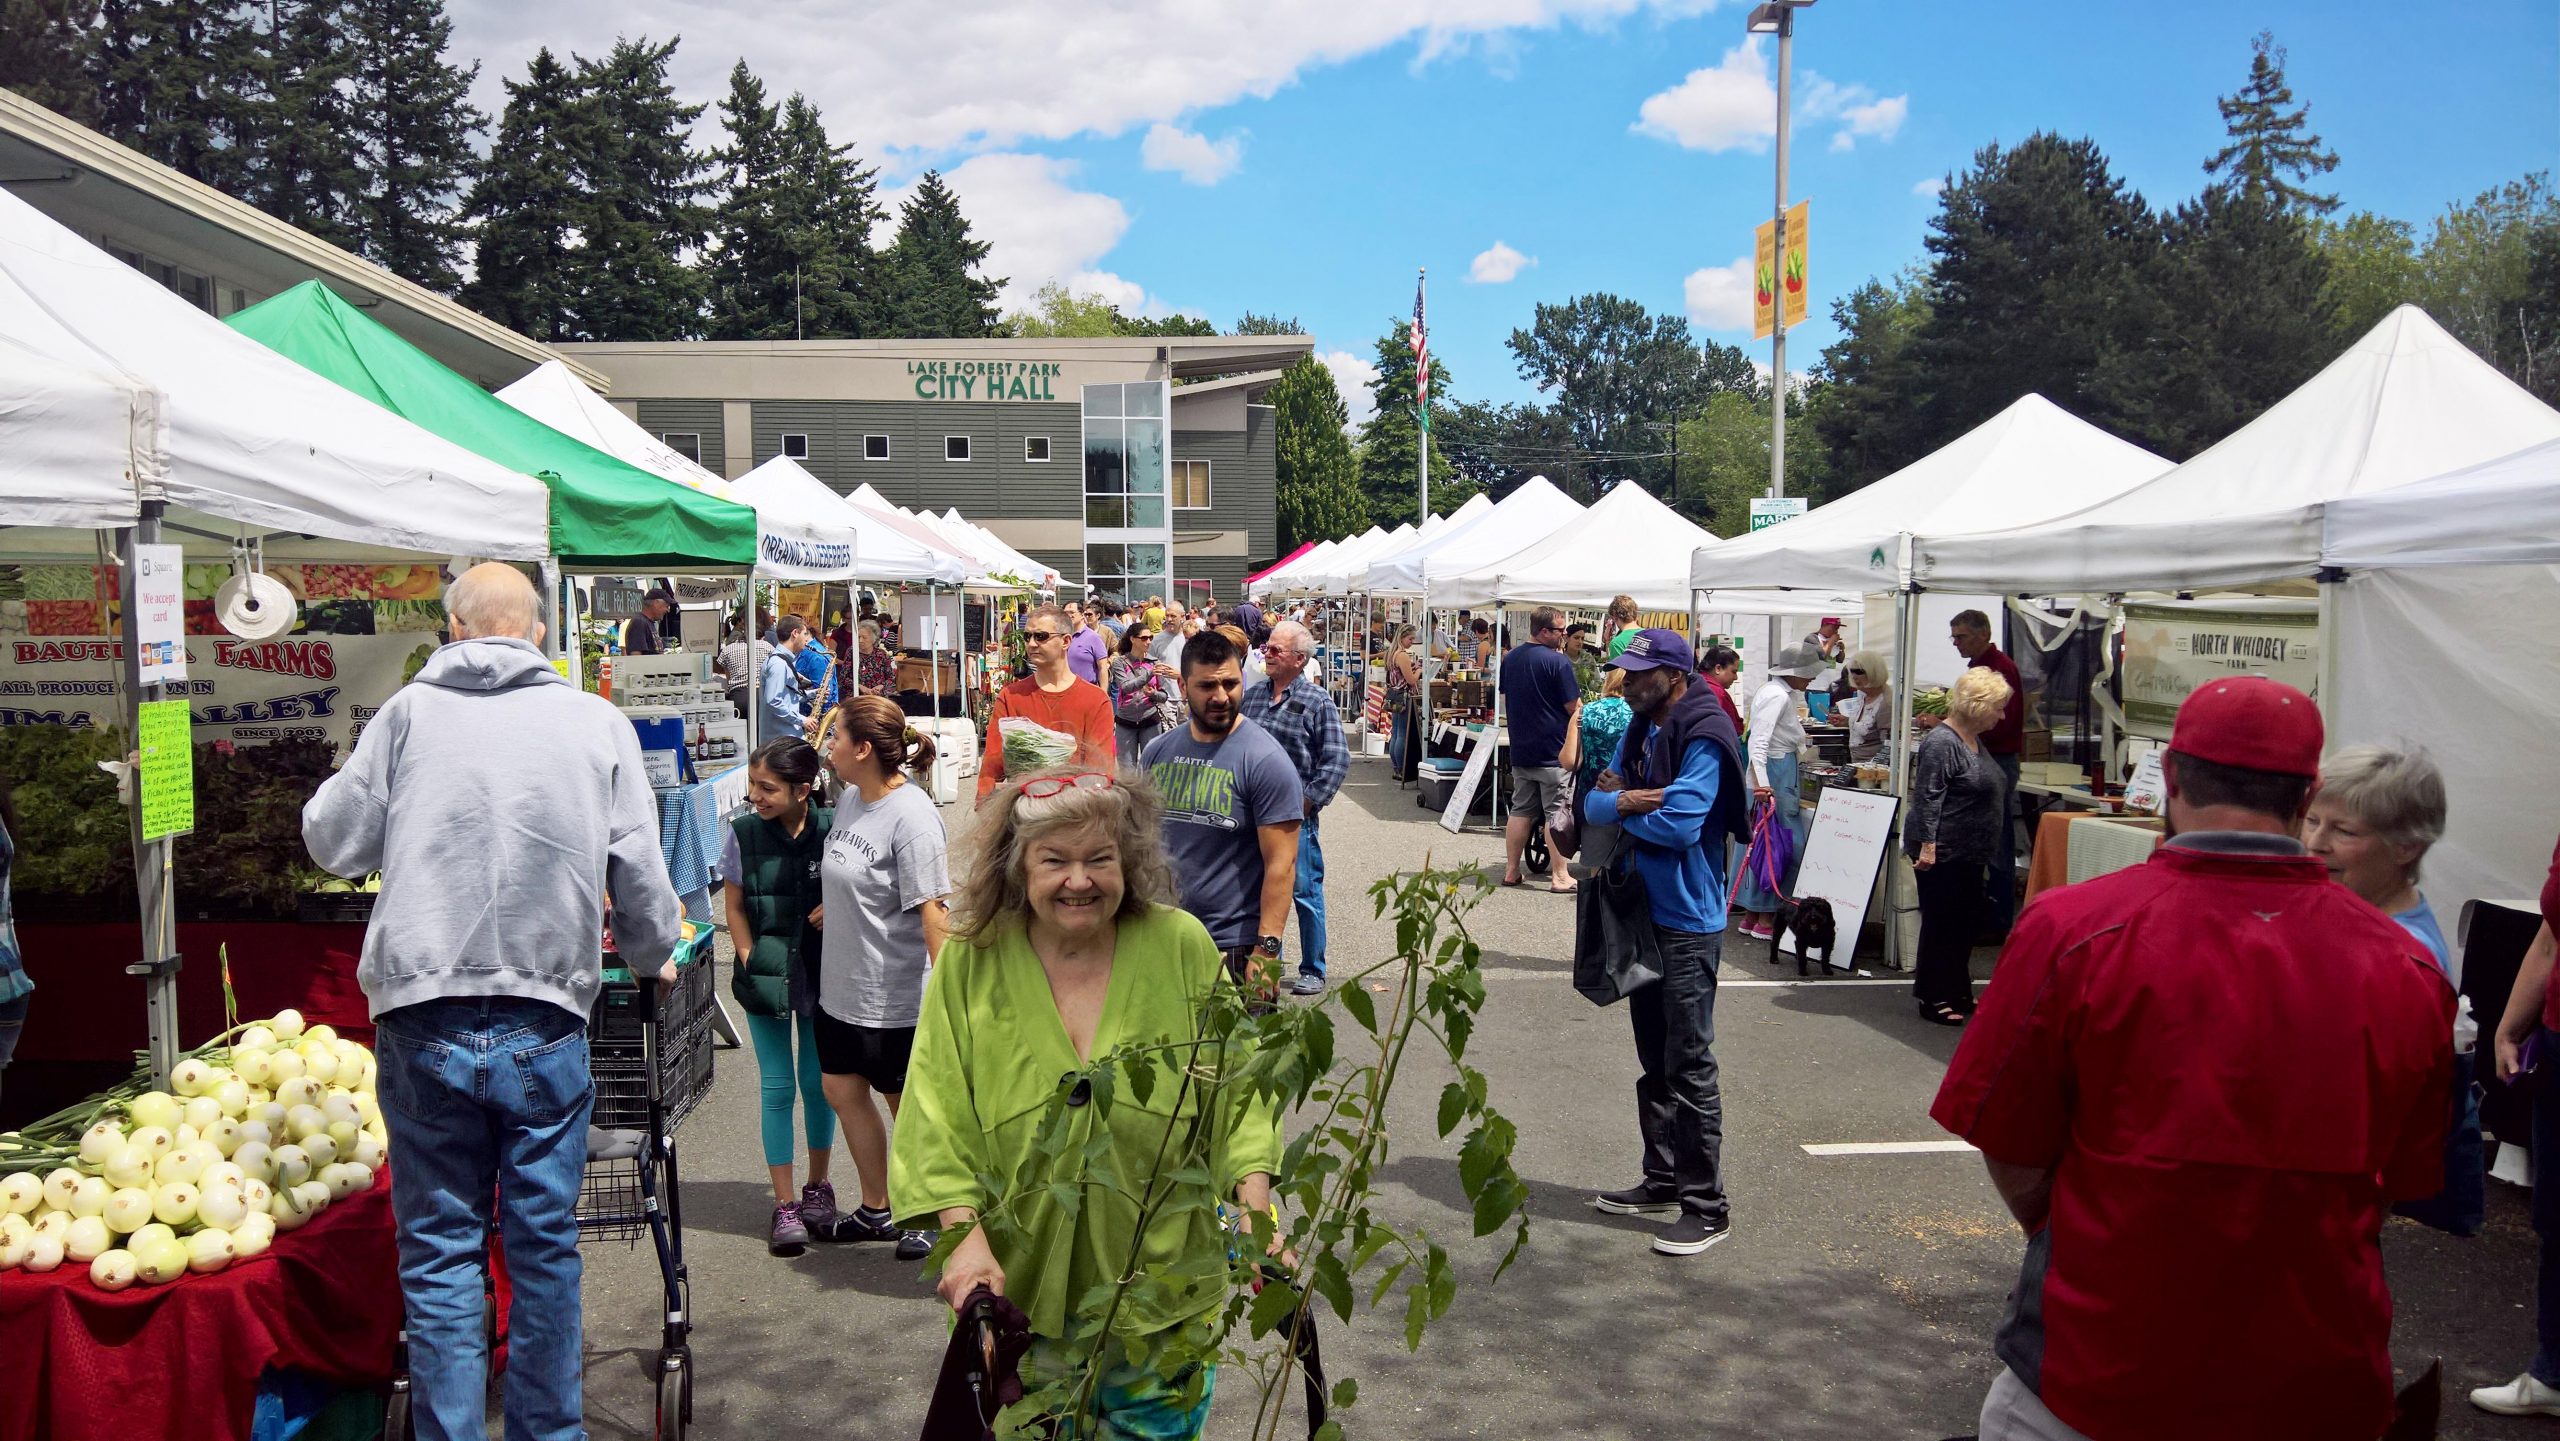
Photo courtesy of www.thirdplacecommons.org
Madrona
Located in one of Seattle’s most diverse neighborhoods, you’ll find artisan foods as well as seasonal produce from Washington state farmers, fishers, and ranchers.
Fridays, 3pm – 7pm | May 13 – Oct 21, 2022
MLK Way & E Union St | Seattle
sfmamarkets.com/madrona-farmers-market

Photo courtesy of sfmamarkets.com
Magnolia
This popular Saturday market is nestled in the tree-lined Magnolia Village. In addition to seasonal fruits and veggies, you’ll find sweet & savory pies, fresh bread, flowers, and more!
Saturdays, 10am – 2pm | June 4 – Oct 15, 2022 + Harvest Market on Nov 19, 2022
W McGraw St & 33rd Ave W | Seattle
seattlefarmersmarkets.org/mfm
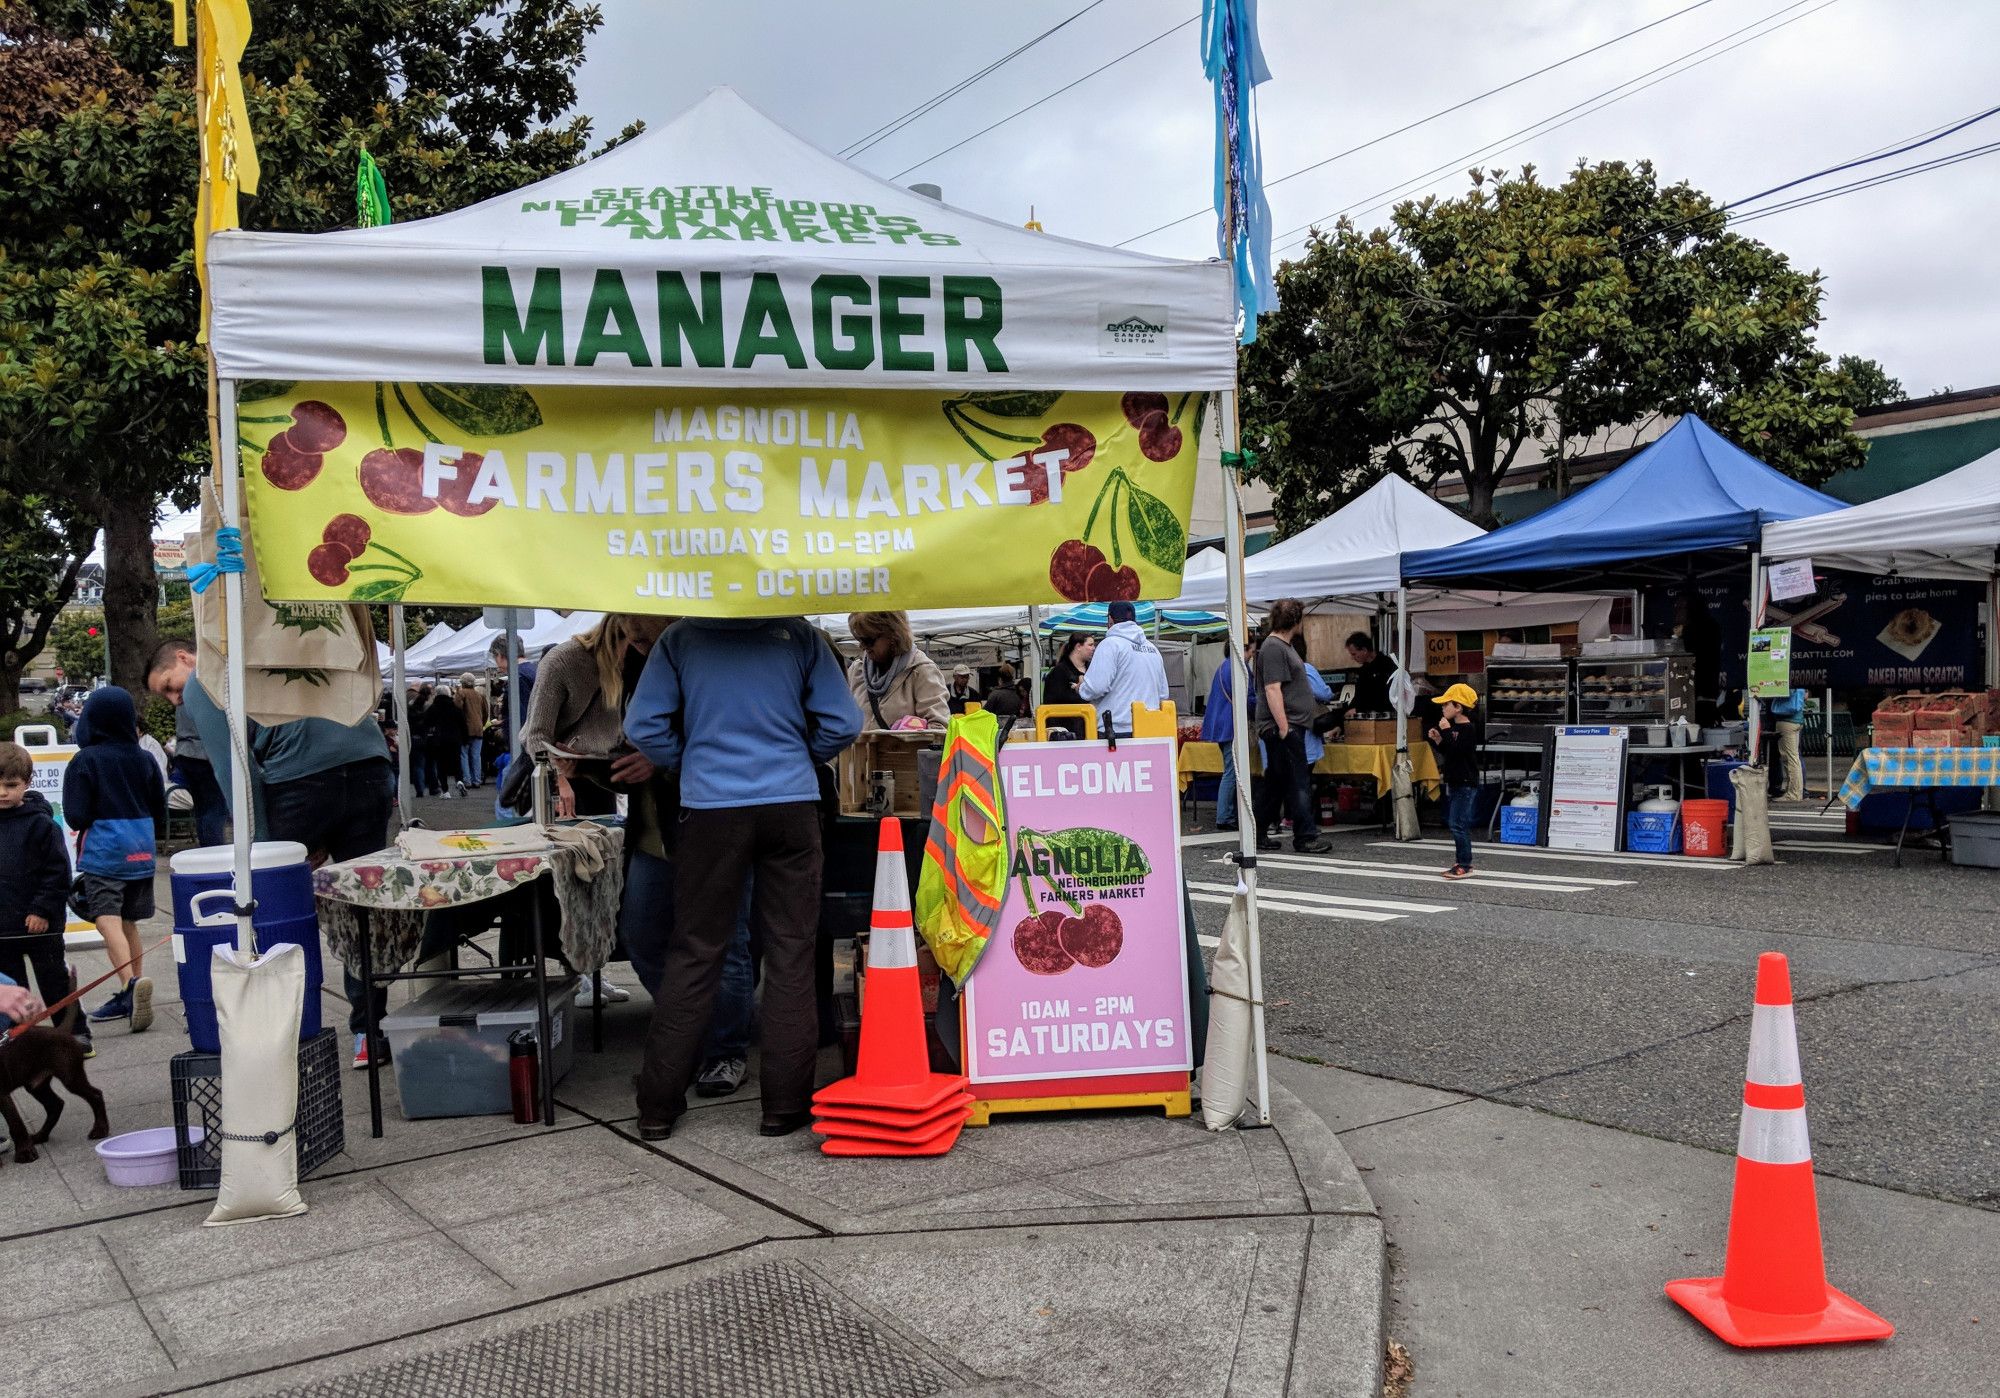
Photo courtesy of pinterest.com
Phinney
A popular gathering spot for both the Phinney Ridge and Greenwood communities, this market is right next door to a playground and offers live music in addition to the great mix of fresh produce and prepared food.
Fridays, 3pm – 7pm | June 3 – Sept 30, 2022
6761 Phinney Ave N | Seattle
seattlefarmersmarkets.org/pfm
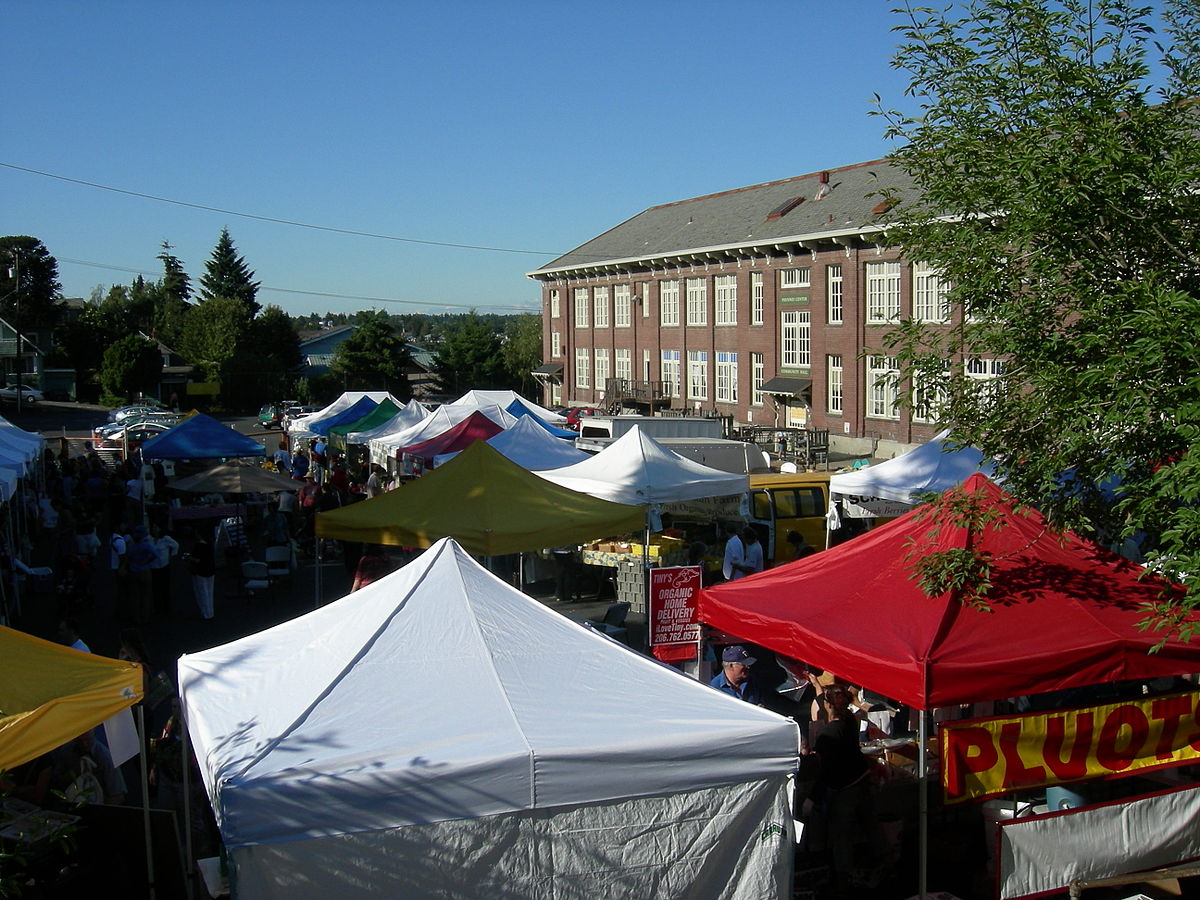
Photo courtesy of wikipedia.org
Pike Place
No introduction needed…make it a day with great restaurants, eateries and retail shops, too.
Daily, 9am – 6pm | Year-Round (Closed Thanksgiving & Christmas)
Pike Place between Pine & Virginia St | Seattle
(206) 682-7453
pikeplacemarket.org
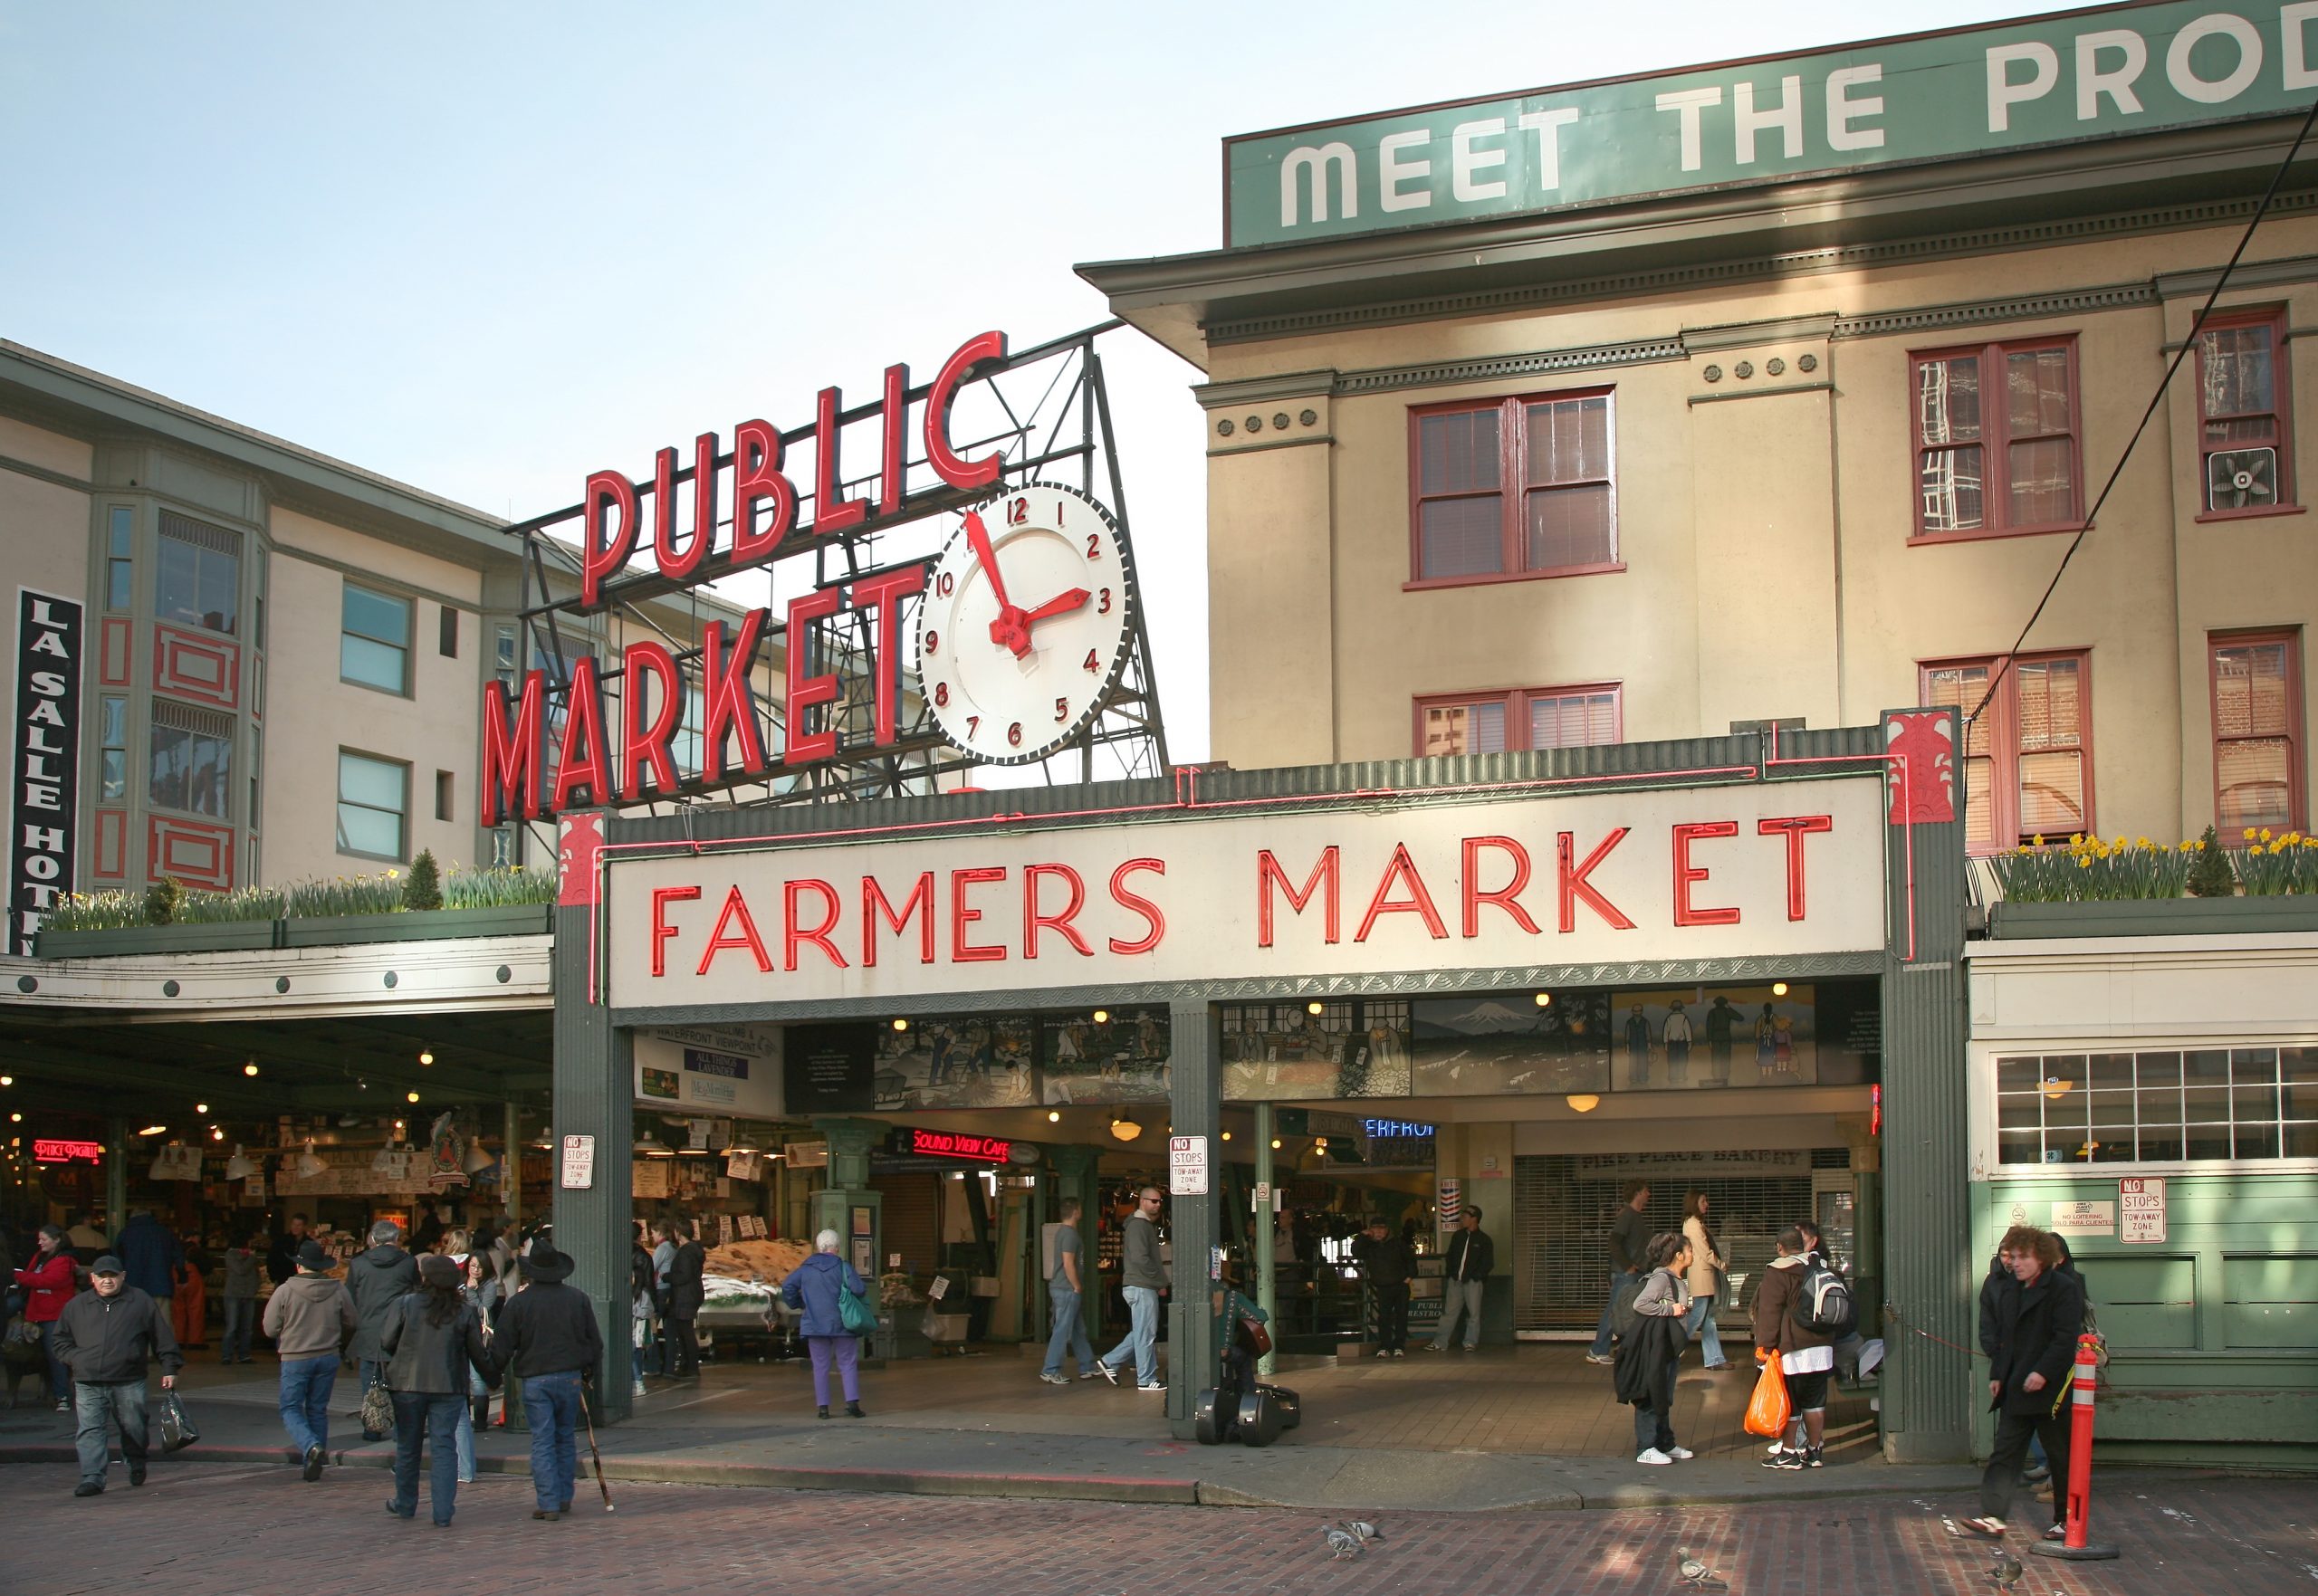
Photo by Daniel Schwen
Queen Anne
Seattle’s only independent farmers market, offering food, chef demos, live music, and children’s activities.
Thursdays, 3pm – 7:30pm | June 2 – Oct 13, 2022 + Harvest Markets on 10/29, 11/19 & 12/17
Queen Anne Ave N & W Crockett St | Seattle
qafm.org
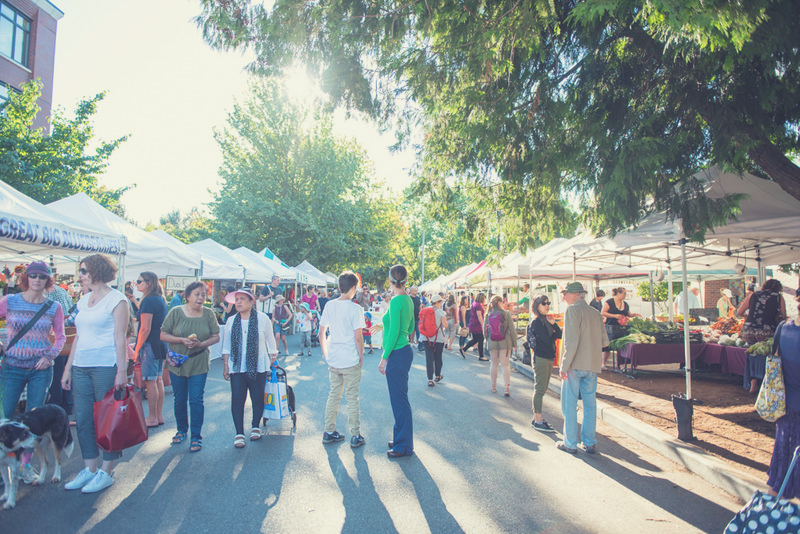
Photo courtesy of qafm.org
Shoreline
Starting this year in their NEW location at the Shoreline Park & Ride, this market offers kids’ programs and live music in addition to its fresh Washington produce, organic meats, bread, honey, and prepared foods. Check out the schedule for info about vendors and entertainment.
Saturdays, 10am – 2pm | June 4 – Oct 1, 2022 + Harvest Markets on 10/29 & 12/17
18821 Aurora Ave N | Shoreline
shorelinefarmersmarket.org
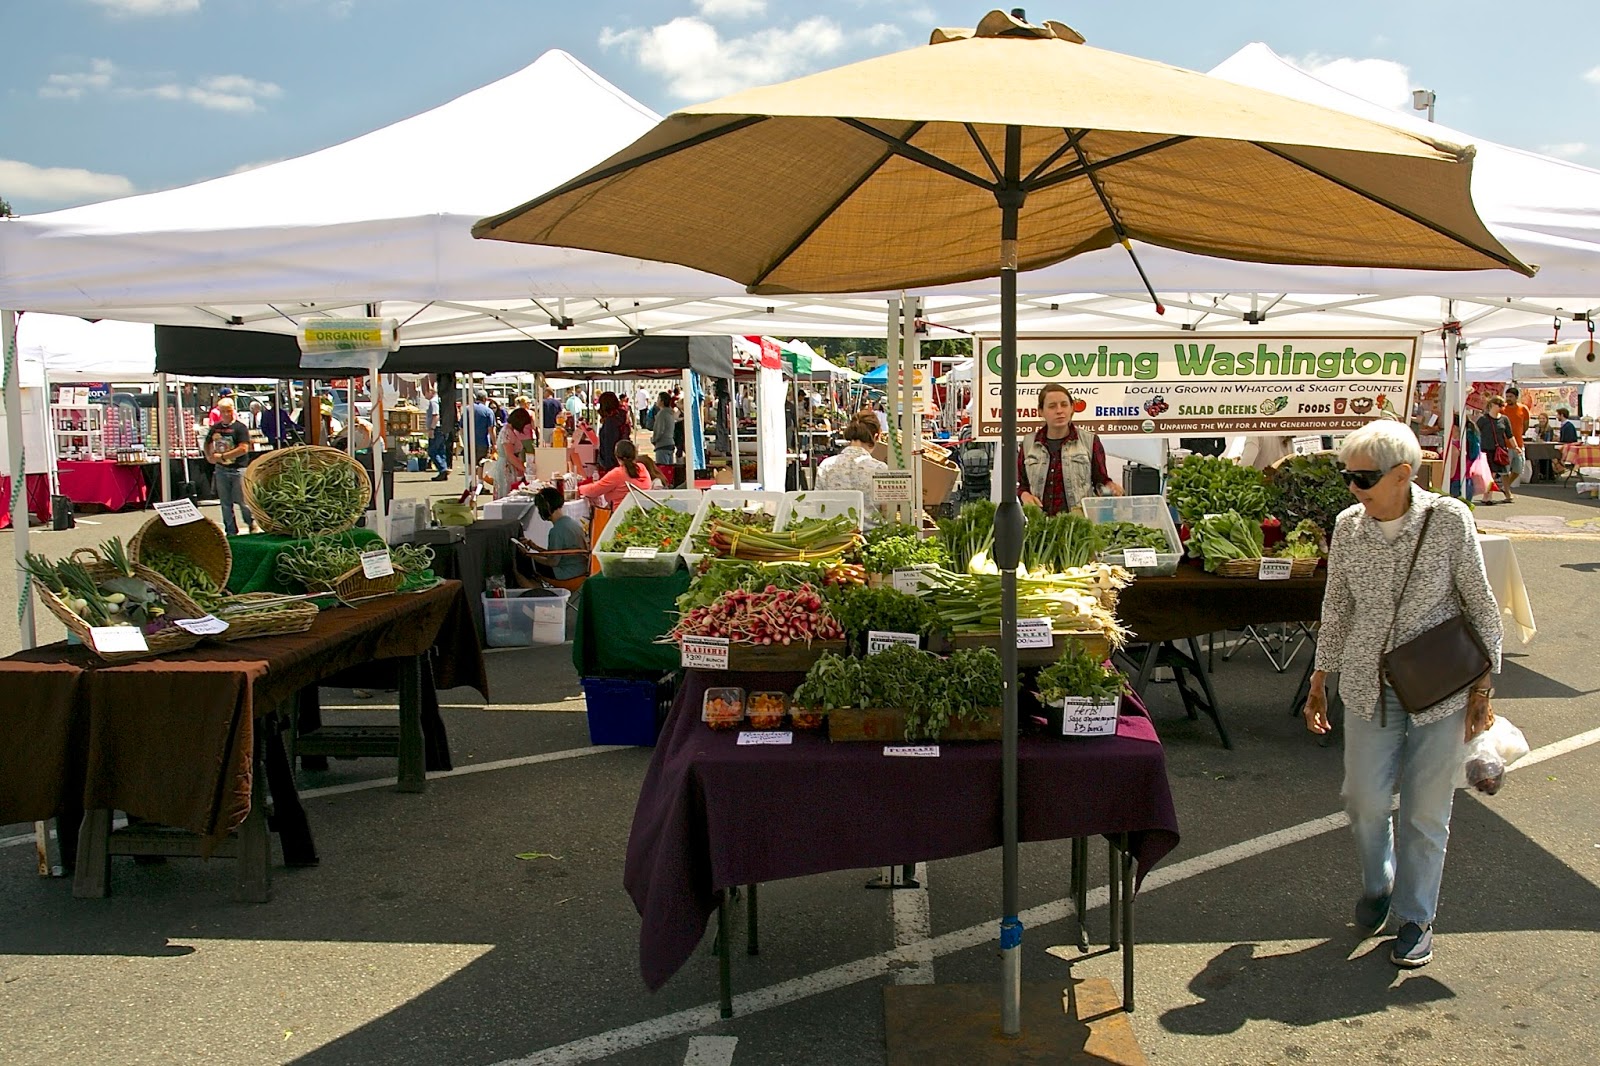
Photo courtesy of www.shorelineareanews.com
University District
Seattle’s only independent farmers market, offering food, chef demos, live music, and children’s activities.
Saturdays, 9am – 2pm | Year-Round
University Way NE (the “Ave”) between 50th & 52nd | Seattle
seattlefarmersmarkets.org/udfm
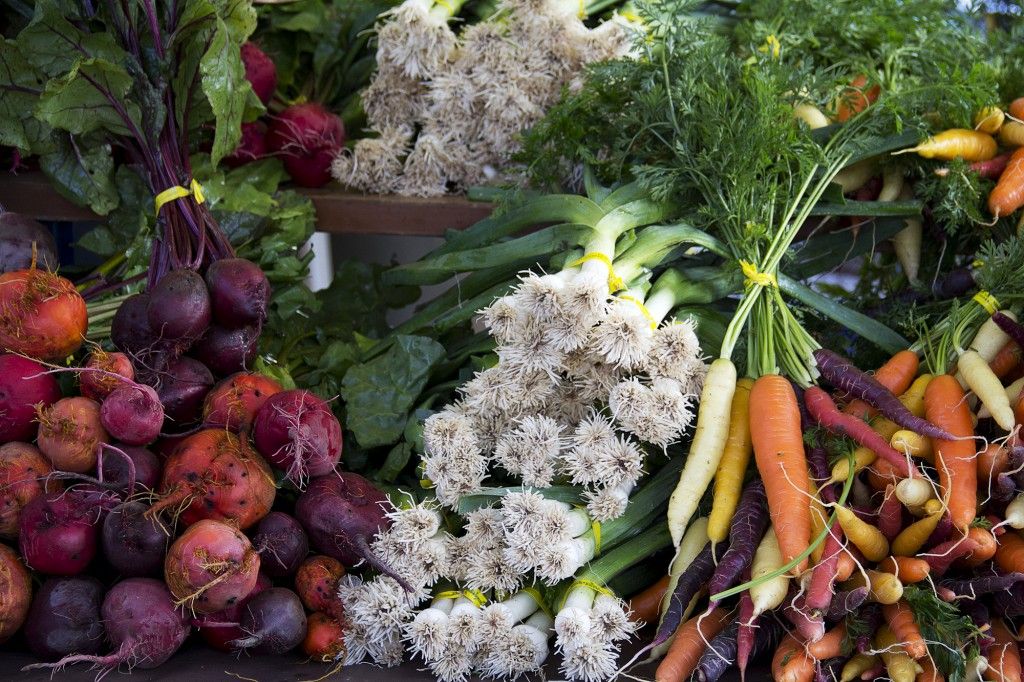
Photo courtesy of pinterest.com
Wallingford
Located in Meridian Park, you can shop with the whole fam and then enjoy a picnic or playtime at the award-winning playground.
Wednesdays, 3pm – 7pm | May 25 – Sept 28, 2022
4800 Meridian Ave N | Seattle
sfmamarkets.com/visit-wallingford-farmers-market/
Photo courtesy of sfmamarkets.com
West Seattle
A South Seattle weekend destination, this market is set in the vibrant West Seattle Junction and features up to 70 vendors during the summertime peak. Great community atmosphere celebrating Washington grown food and ingredients.
Sundays, 10am – 2pm | Year-Round
California Ave SW & SW Alaska | Seattle
seattlefarmersmarkets.org/wsfm
Photo courtesy of westseattleblog.com
Greater Eastside
Bellevue – Crossroads
East Bellevue’s market features fruits, veggies & dairy products from Washington state farms along with handmade soaps, candles, greeting cards, herbal wellness products, and more. Don’t missed the locally roasted coffee and handmade ice cream sandwiches, too!
Tuesdays, 12pm – 6pm | June 7 – Sept 27, 2022
15600 NE 8th St | Bellevue
https://crossroadsbellevue.com/music-events/crossroads-farmers-market/
Photo courtesy of crossroadsbellevue.com
Bellevue – Downtown
Set in the heart of Downtown Bellevue, this market offers goods exclusively produced within Washington state—from seasonal fruits & veggies to flowers, fresh meats, artisan goods, and prepared cuisine. The Kids’ POP club empowers kids to know where their food comes from and make healthy eating choices.
Thursdays, 3pm – 7pm | May 12 – Oct 6, 2022
Harvest Markets: 10am – 2pm on Sat, 10/15; Sat, 11/19; & Sat, 12/17
1717 Bellevue Way NE | Bellevue
bellevuefarmersmarket.org
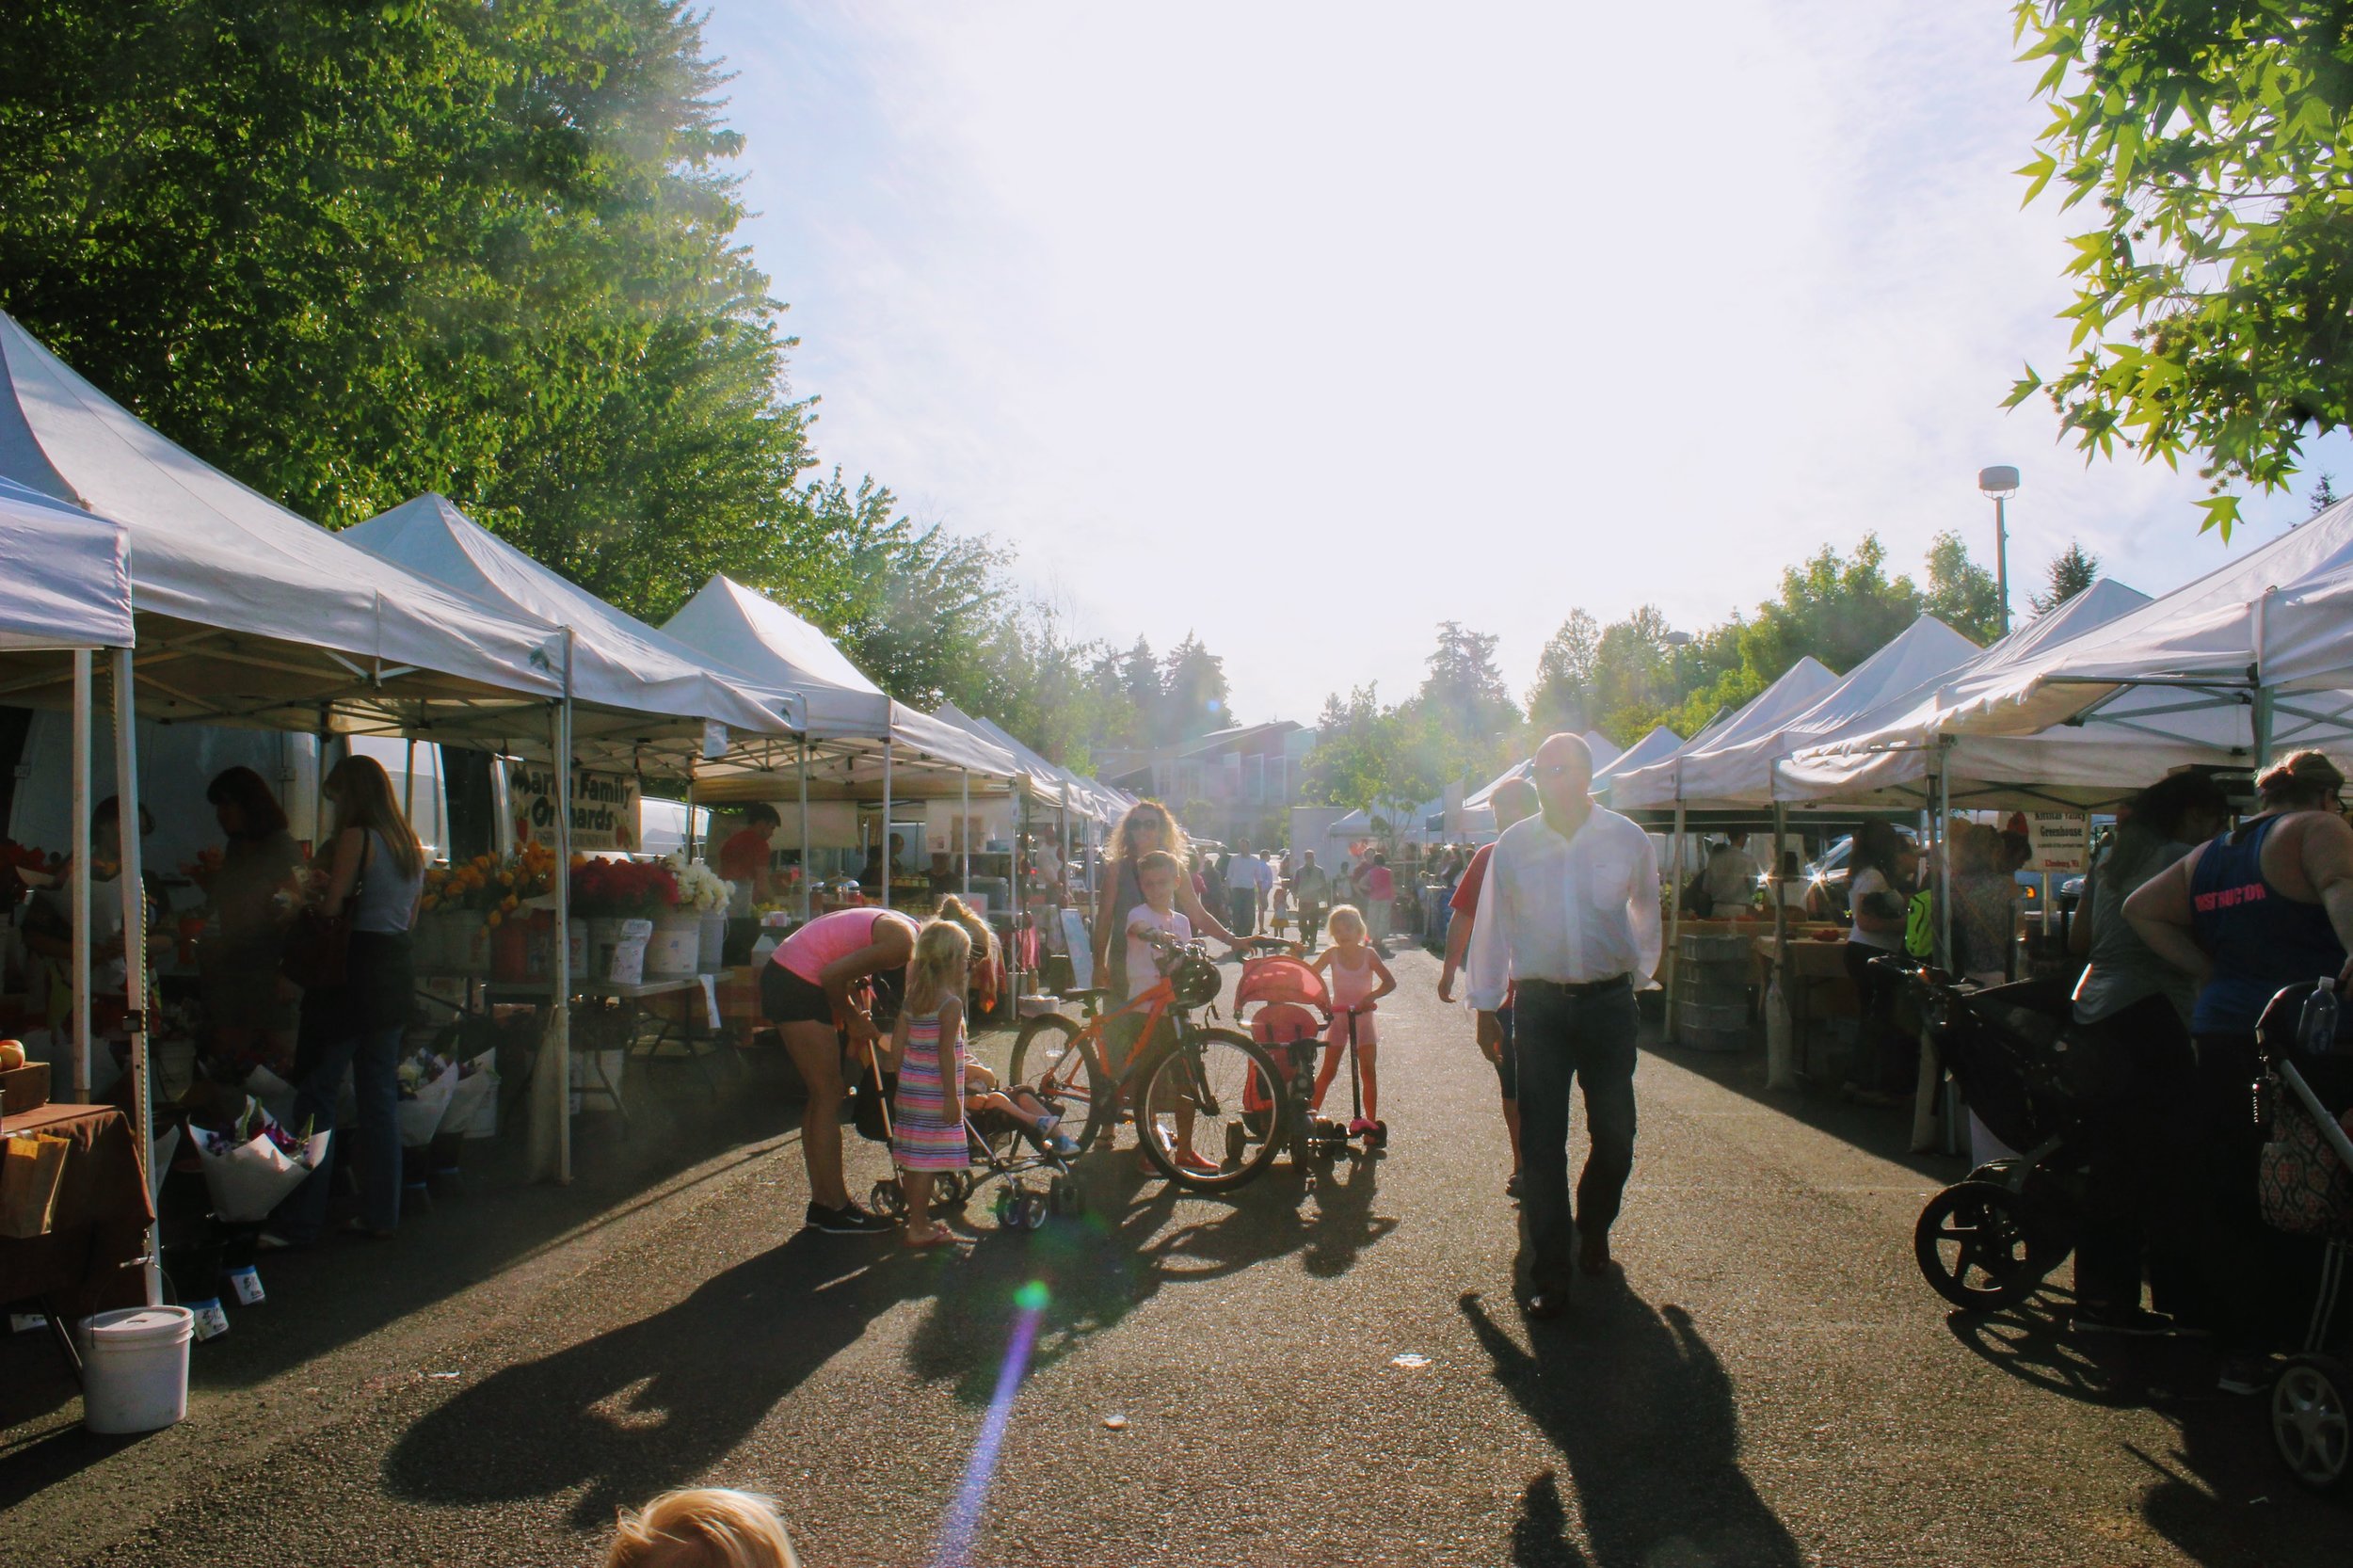
Photo courtesy of eatbellevue.com
Carnation
Set in the heart of the Sno-Valley farming district, you’ll find plenty of freshly picked produce along with live music and educational activities for the kids.
Tuesdays, 3pm – 7pm | June, July & August 2022
Bird St & Stossel Ave | Carnation
carnationfarmersmarket.org
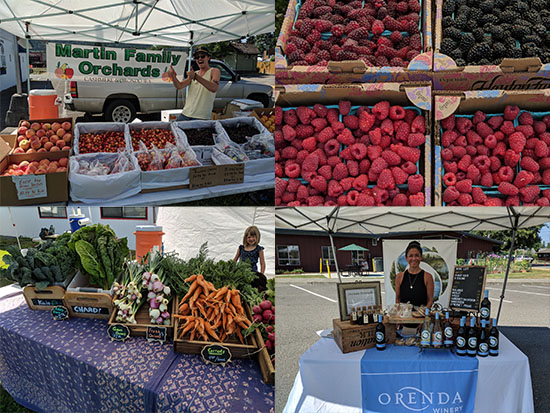
Photo courtesy of carnationfarmersmarket.org
Duvall
Nestled alongside the scenic Snoqualmie River, this friendly market features local eggs, jams, fresh roasted coffee, arts, crafts, and baked goods in addition to the seasonal veggies, fruits, and plant starts. Live music, picnic shelters and a playground make this a fun family destination.
Thursday, 3pm – 7pm | May 5 – October 13, 2022
Taylor Landing at 16201 Main St NE | Duvall
duvallfarmersmarket.org
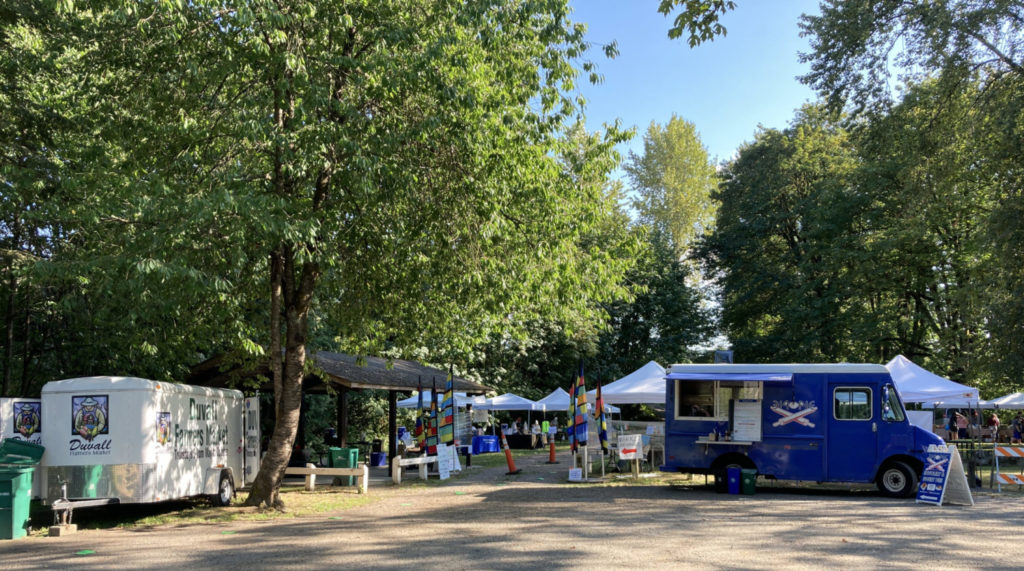
Photo courtesy of duvallfarmersmarket.org
Issaquah
Located at the historic Pickering Barn, this picturesque venue offers a variety of fresh farm and food-based products, concessions, and local artisans.
Saturdays, 9am – 2pm | May 7 – Sept 24, 2022
1730 10th Ave NW | Issaquah
www.issaquahwa.gov/778/Farmers-Market
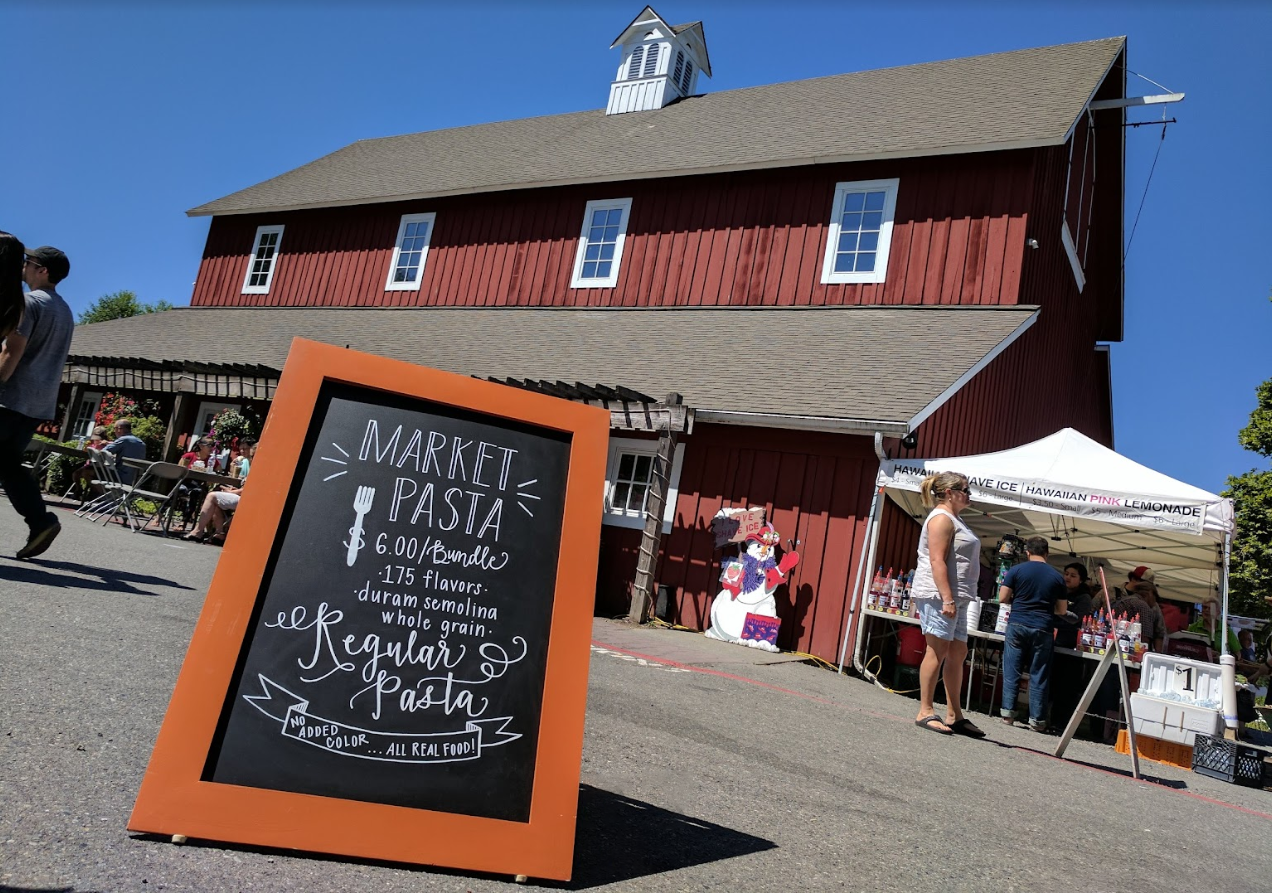
Photo by Saifu Angto, courtesy of google.com
Kirkland – Downtown
This stunning setting on the Lake Washington shoreline turns shopping into a day at the beach. Peruse local produce and goods, then go for a swim or stroll along Moss Bay. Perfect for a picnic, too!
Wednesdays, 3pm – 7pm | June – September, 2022
Marina Park, 25 Lakeshore Plaza | Kirkland
kirklandmarket.org
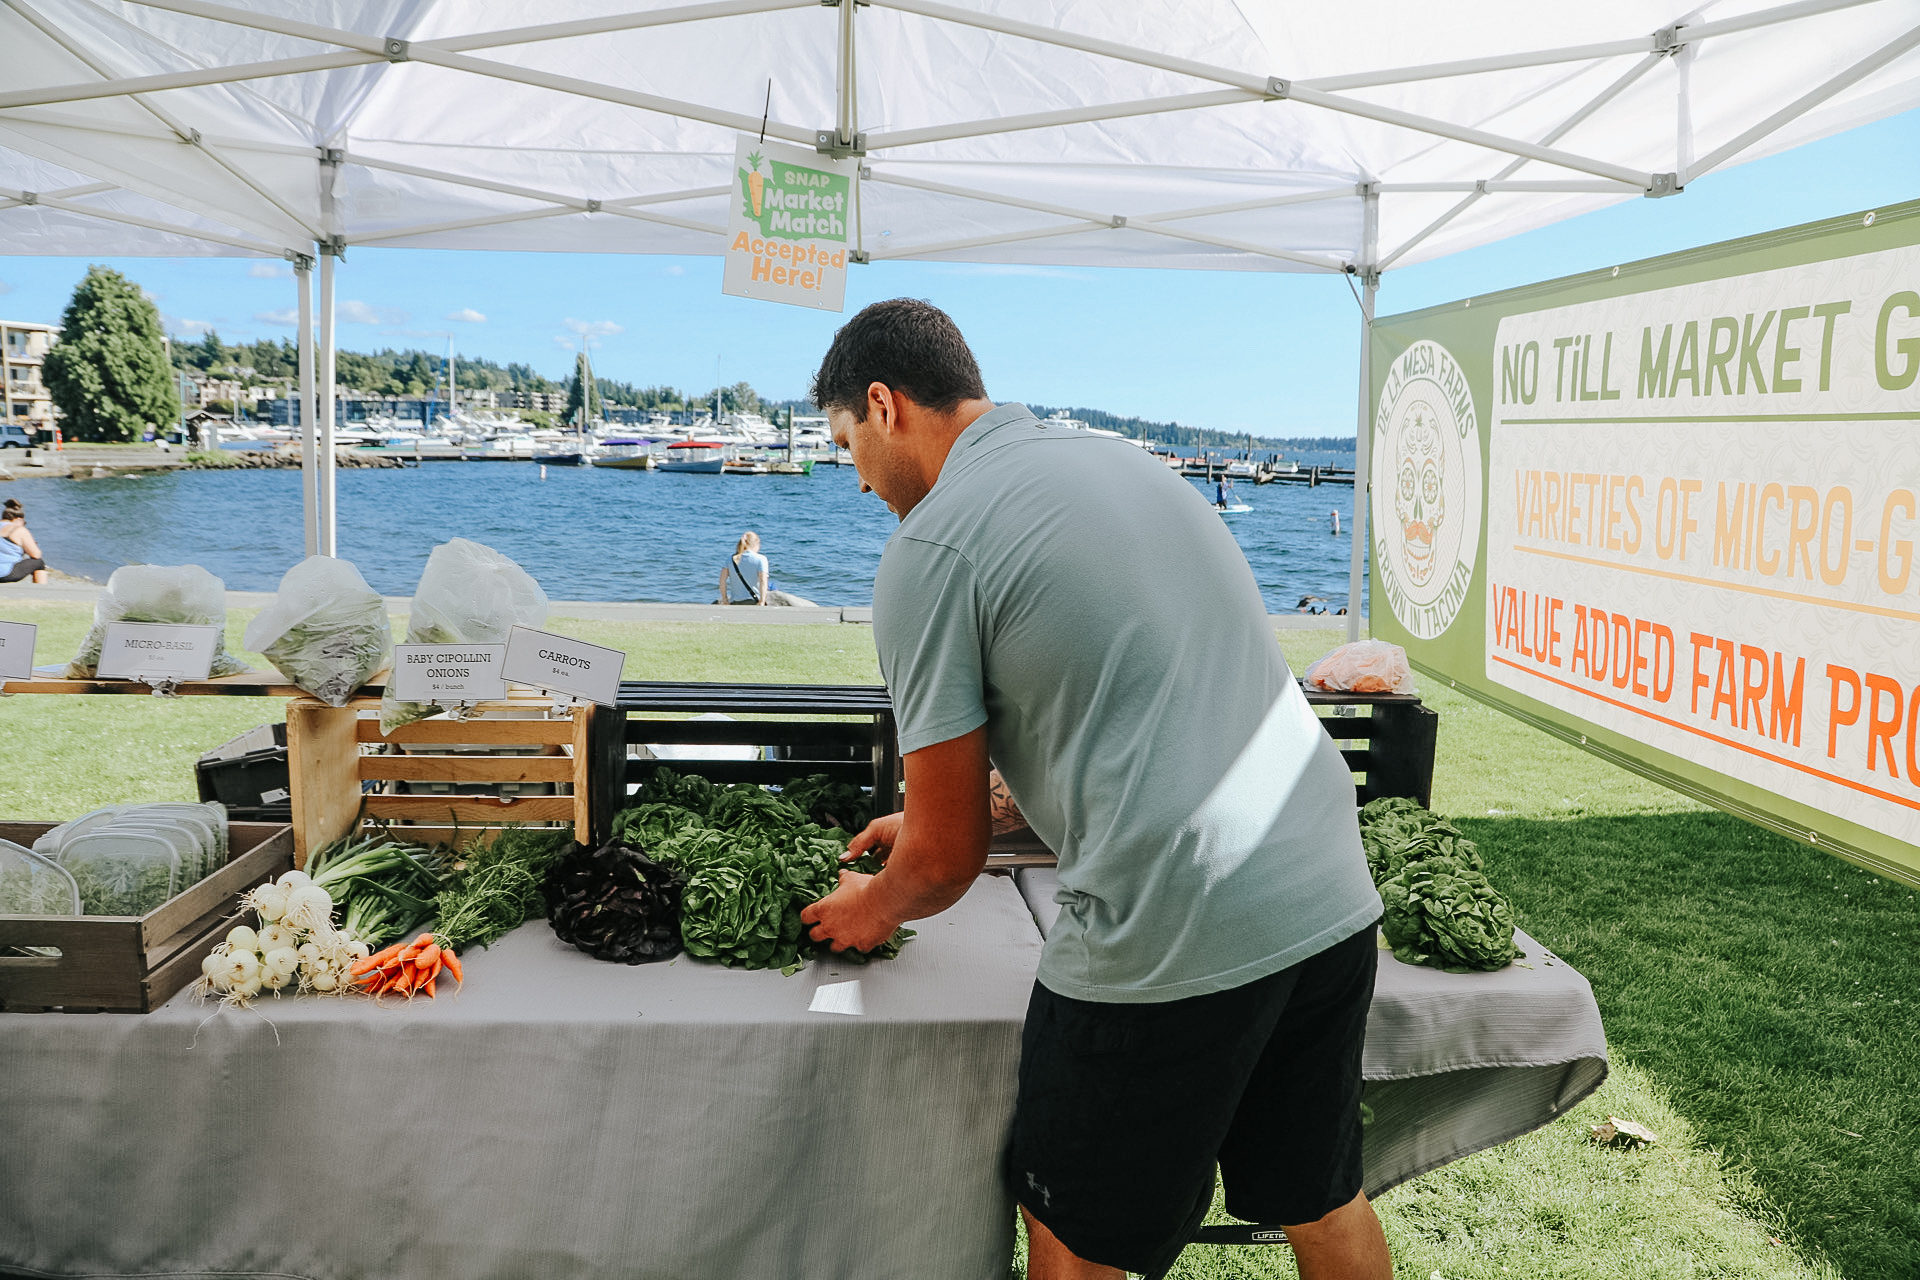
Photo courtesy of kirklandmarket.org
Kirkland – Juanita
Set in beautiful Juanita Beach Park on Lake Washington, you’ll find as many as 30 vendors offering farm fresh local produce, herbs, honey, nuts, flowers, plants, baked good, handcrafted items, and prepared cuisine. Make it a date with live music and a picnic at the beach. There’s a great playground for the kids, too.
Fridays, 3pm – 7pm | June – Sept, 2022
Juanita Beach Park, 9703 NE Juanita Dr | Kirkland
www.kirklandwa.gov
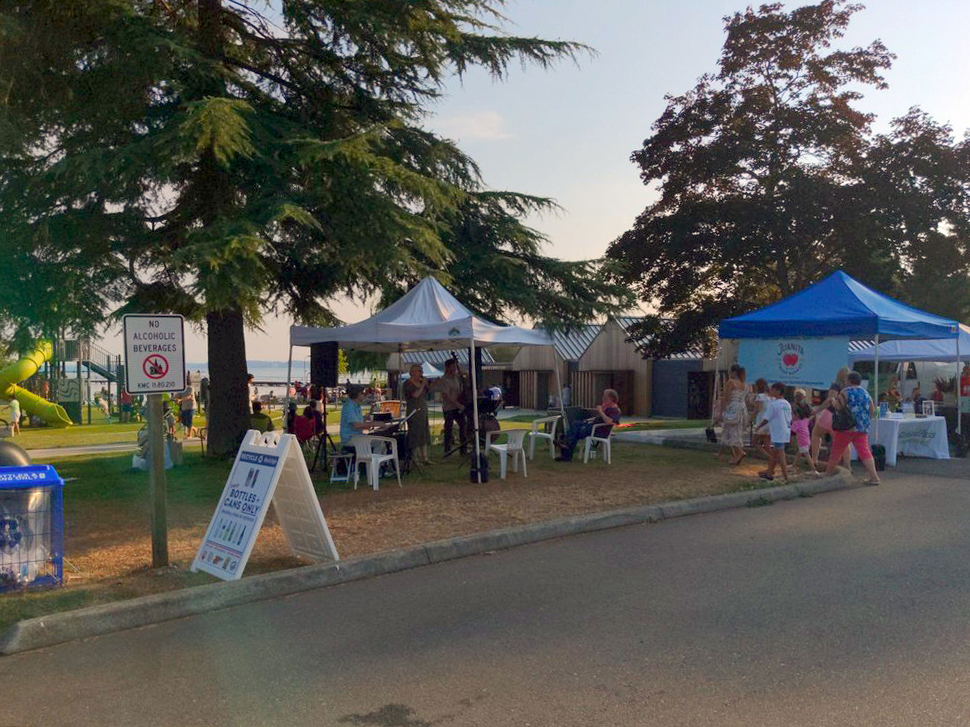
Photo courtesy of yelp.com
Mercer Island
Our office is so proud to sponsor this year’s Mercer Island Farmers Market! Come on down for quality local Washington state produce, cheese, fish, meat, bread, and more. Check out the live music schedule, too!
Sundays, 10am – 3pm | June – Sept, 2022
7700 SE 32nd St | Mercer Island
www.mifarmersmarket.org
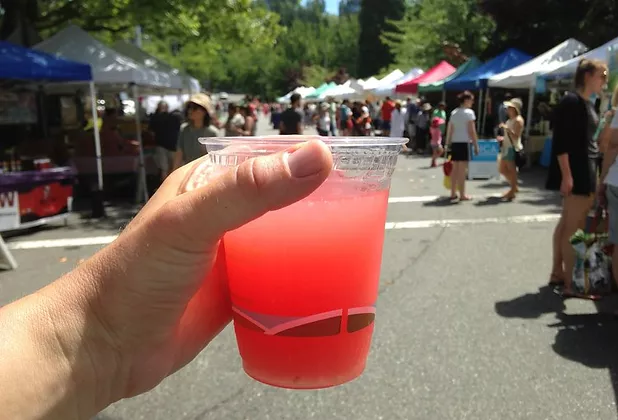
Photo courtesy of www.mifarmersmarket.org
North Bend
This relaxed market enjoys live music and a spectacular Mount Si view. Vendors offer fresh produce, berries, honey, flowers, baked goods, hand-crafted items, and delicious prepared foods. Two playgrounds plus play fields and a covered picnic shelter make this a fun hangout spot. Leashed pets are welcome, too!
Thursdays, 4pm – 8pm | June 9 – Sept 8, 2022
Si View Park, 400 SE Orchard Dr | North Bend
www.siviewpark.org/farmers-market.phtml
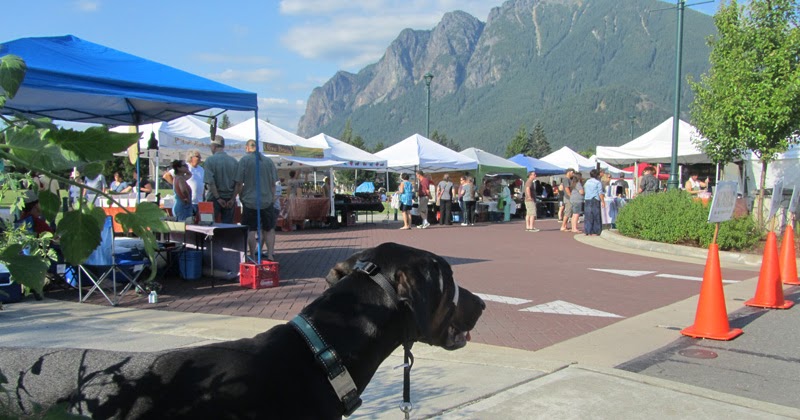
Photo courtesy of thequiltingdoberman.blogspot.com
Redmond
Going strong since 1976, the Redmond Saturday Market offers a huge selection of vendors and dazzling array of produce, flowers, cheeses, preserves, salmon, tea, and handmade goods such as pottery and soaps. You’ll love the ready-to-eat foods, too.
Saturdays, 9am – 2pm | May 7 – Oct 29, 2022
9900 Willows Rd | Redmond
www.redmondsaturdaymarket.org

Photo by Jeff, courtesy of google.com
Renton
Find exclusively Washington-produced fruits, veggies, handmade goods, arts, crafts and more right in the heart of downtown Renton at Piazza Park. Food trucks, live music, and kids’ activities such as the “Healthy Kids Corner” make this a fun spot to liven up your Tuesday.
Tuesdays, 3pm – 7pm | June – Sept, 2022
Piazza Park, 233 Burnett Ave. S | Renton
www.rentonfarmersmarket.com
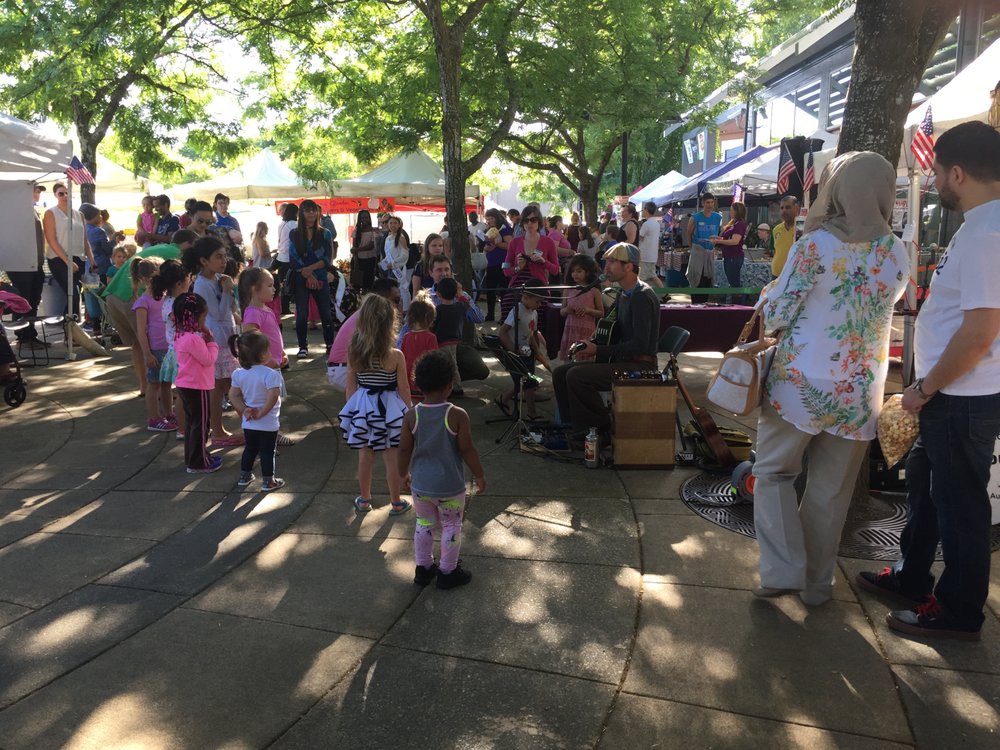
Photo courtesy of yelp.com
Sammamish
Each Wednesday, the Sammamish Commons plays host to a variety of local farmers, nurseries, bakeries, artisans, food vendors, and more. Live music and kids’ activities, too!
Wednesdays, 4pm – 8pm | May – Sept, 2022
Sammamish Commons, 801 228 Ave SE | Sammamish
www.sammamishfarmersmarket.org
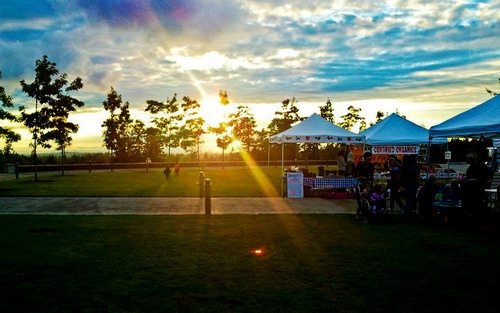
Photo courtesy of sammamishfarmersmarket.org
Woodinville
New location this year! Come check out downtown Woodinville’s newly renovated Schoolhouse District and find produce grown in the state of Washington (and picked fresh for that morning!). You’ll also have an array of boutique baked goods, sauces, cider, artisans, and more to peruse. Check out the calendar for live entertainment, music, demos, and other activities.
Saturdays, 10am – 3pm | May – Sept, 2022
13205 NE 175th St | Woodinville
woodinvillefarmersmarket.com
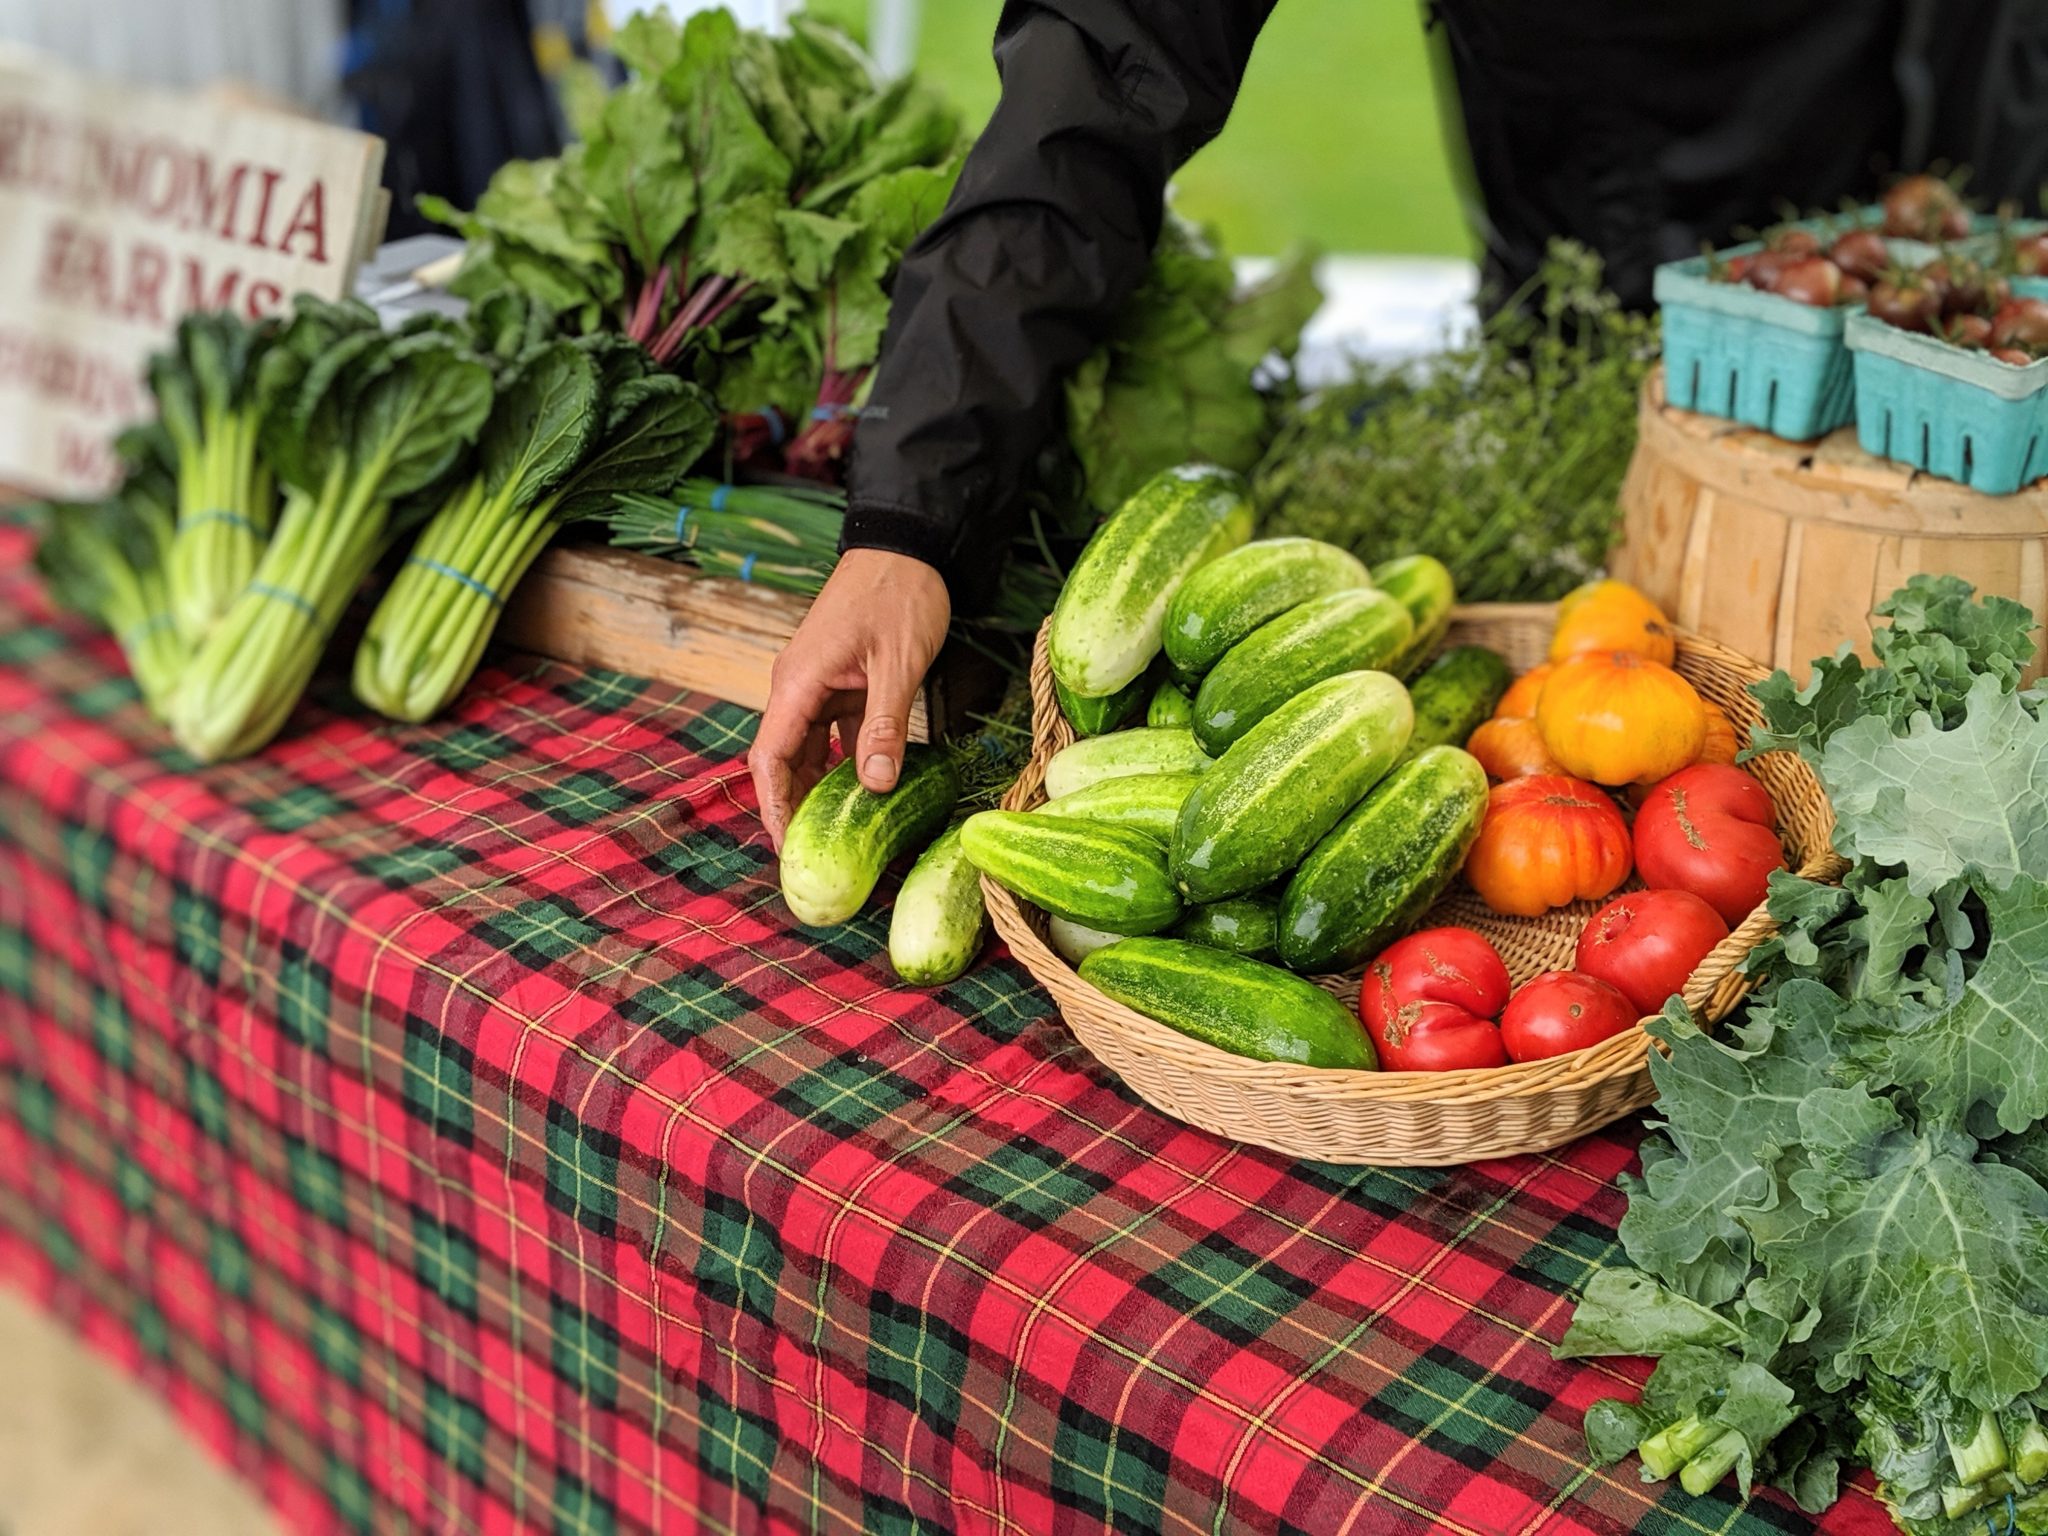
Photo courtesy of woodinvillefarmersmarket.com
We earn the trust and loyalty of our brokers and clients by doing real estate exceptionally well. The leader in our market, we deliver client-focused service in an authentic, collaborative, and transparent manner and with the unmatched knowledge and expertise that comes from decades of experience.
© Copyright 2022, Windermere Real Estate/Mercer Island.
How’s the Market? Q1 Real Estate Review

Across the region, home values continued to see huge year-over-year gains from 2021 to 2022. Most homes sold in the first 10 days and for well above the asking price. We started the year with an extreme shortage of homes for sale, resulting in an overall lower number of sales compared to the start of 2021. Buyer demand, however, remains incredibly strong.
With interest rates on the rise, buyers are feeling more pressure than ever to secure a home. We are hoping to see more listings come to market this spring and provide some much needed relief for weary house hunters.
Click or scroll down to find your area report:
Seattle | Eastside | Mercer Island | Condos | Waterfront
SEATTLE
The Seattle real estate market for single family homes is off and running! The median sale price is up 6% since the end of 2021. Which means: Seattle’s price gains were as much in the first quarter as all of 2021. Year over year, the median price rose from $800,000 in Q1 2021 to $910,000 in Q1 2022.
For anyone who has focused their home search on the Eastside and has come up empty handed in 2021, Seattle could seem like an affordable opportunity this year. Seattle’s price gains were strong, albeit conservative in comparison with the Eastside. More plentiful active inventory (relatively speaking), and a more affordable median sale price of $910,000 (vs $1,625,000 on the Eastside) indicate that Seattle could be a bright spot of hope for any buyers left behind by the Eastside’s double-digit gains.
Rising interest rates in late Q1 are sure to play a part in the weary home buyer’s decision-making process. However, the close of quarter numbers are encouraging: 82% of homes sold in the first ten days!
Click here for the full report and neighborhood-by-neighborhood statistics!
EASTSIDE
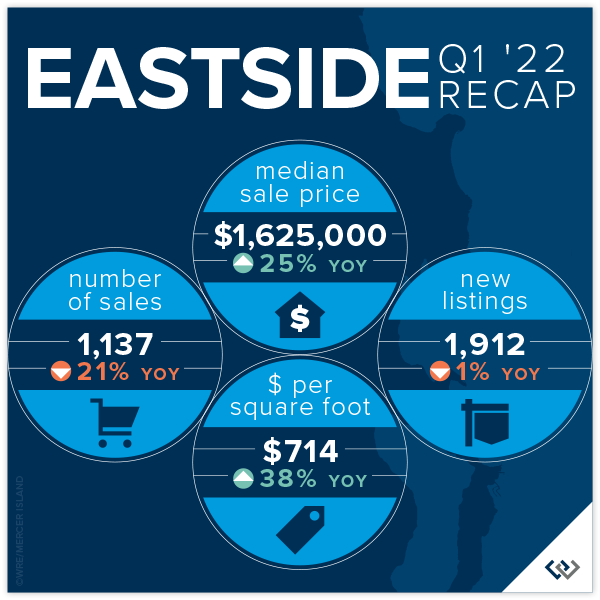
Once again Eastside Real Estate is off to an incredible start in the first 3 months of the year. Multiple offers and wildly aggressive escalation clauses are the story of the day, and not just anecdotally—the numbers don’t lie. The average list to sale price ratio was a staggering 119%, which means the typical home listed at $1,000,000 sold for closer to $1,190,000. This is an even stronger showing than the previous record high of 112% in Q1 of 2021.
New listings were relatively flat compared to Q1 of 2020 and 2021 (1912 vs 2058 and 1935 respectively) while the total number of sales were down 21% (1137 vs 1413 in the prior year). We believe this can be explained by looking at the trailing inventory from the previous Q4 in both cases (1496 vs 1238). There were just fewer homes for sale, certainly not less demand. This was reflected in the overall price gain of 25%!
Without a crystal ball it will be tough to tell exactly how much impact the market will feel from the steep rise in interest rates. In the short term, everyone seems to be taking a deep breath as we move into Q2. Overall, the Eastside’s core values—highly ranked schools, community focused neighborhoods, and close commute proximity to some of the area’s largest employers—should keep the area in high demand!
Click here for the full report and neighborhood-by-neighborhood statistics!
MERCER ISLAND
Mercer Island by the averages was quite shocking in Q1 of 2022: 3 homes per sale per week, 11 days on market, and 111% list price to sale price. This translates to buyers who would have otherwise joined our community casting a wider net to places like Bellevue, Issaquah, and Sammamish.
One of the affordability indicators that we historically track has become obsolete over the past few quarters: number of homes listed/sold under $1,000,000. In fact, there was only one home listed under $1,500,000 in Q1. 21 of the 39 homes had sale prices above $2,000,000 and 9 were above $3,000,000!
If you’re a buyer trying to break into the Mercer Island market, patience and the ability to act fast are the top two tips we have for you. 85% of the 39 homes for sale in Q1 sold within the first 10 days. Working with a local pro will be your biggest advantage.

Click here for the full report and neighborhood-by-neighborhood statistics!
CONDOS – SEATTLE & EASTSIDE
Condos continue to gain ground early in 2022. While the year-over-year median price gains are conservative compared to the single-family market, we see this as a good thing! Condos are a bright spot for today’s home buyers as interest rates rise.
Seattle condos saw a 9% increase (to $519,000). Eastside condos are up 16% (to $625,000) a 26% lift in price per square foot compared to Q1 2021.
Shoreline and East Bellevue led the market in median price gains year over year, up 66% and 48% respectively. Queen Anne and Kirkland were the most conservative with 1% and 4% gains respectively. 85% of Eastside condos sold over the list price, so if you’re shopping be prepared to compete.
Check out area-by-area details the full condo report.
WATERFRONT
If the first three months are any indication, it will be a tight inventory year in the Waterfront real estate market. On all shorelines, there were a total of 17 homes sold overall with an average of only 6 listings for sale at any one time. The good news is that we’re up from this time last year when there were only 14 homes sold overall.
Notably, the highest overall sale (at $12,750,000) was on Lake Sammamish in Issaquah! The most affordable waterfront this quarter was a home in Rainier Beach that sold for $1,362,500.
This brief overview of the entire Seattle-Eastside private waterfront market, including Mercer Island and Lake Sammamish, illustrates the trends occurring in our region over time. This data is interesting and insightful but cannot replace an in-depth waterfront analysis provided by a savvy broker with years of local waterfront experience.
We earn the trust and loyalty of our brokers and clients by doing real estate exceptionally well. The leader in our market, we deliver client-focused service in an authentic, collaborative, and transparent manner and with the unmatched knowledge and expertise that comes from decades of experience.
© Copyright 2022, Windermere Real Estate/Mercer Island. Information and statistics derived from Northwest Multiple Listing Service and deemed accurate but not guaranteed.
Should You Remodel or Sell Your Home As Is?

Homeowners who are preparing to sell are often faced with a dilemma about whether to remodel or sell their home in its current state. Each approach has its respective advantages and disadvantages. If you decide to remodel your home, it will likely sell for more; but the increased selling price will come at the cost of financing the remodeling projects. If you decide to sell without remodeling, you won’t spend as much money putting your home on the market, but the concern is whether you’re leaving money on the table.
Should I Remodel or Sell My Home As Is?
To answer this question, it’s important to understand the factors that could influence your decision and to work closely with your agent throughout the process.
Cost Analysis: Home Remodel vs. Selling Your Home As Is
Home Remodel
When you remodel your home before selling, you’re basically making a commitment to spend money to make money. So, it’s important to consider the kind of ROI you can expect from different remodeling projects and how much money you’re willing to spend. Start by discussing these questions with your agent. They can provide you with information on what kinds of remodels other sellers in your area are making and the returns they’re seeing as a result of those upgrades. This will help you determine the price of your home once your remodel is complete.
Then, there’s the question of whether you can complete you remodeling projects DIY or if you’ll need to hire a contractor. If hiring a contractor seems expensive, know that those costs come with the assurance that they will perform quality work and that they have the skill required to complete highly technical projects.
According to the Remodeling 2021 Cost vs. Value Report for Seattle (www.costvsvalue.com1), on average, Seattle-area homeowners paid $28,967 for a midrange bathroom remodel and $29,183 for a minor kitchen remodel, with a 76.9% and 87.7% ROI respectively. This data shows that, for these projects, you can recoup a chunk of your costs, but they may not be the most cost-effective for you. A more budget-friendly approach to upgrading these spaces may look like repainting your kitchen cabinets, swapping out your old kitchen backsplash for a new one, refinishing your bathroom tub, or installing a new showerhead. Other high-ROI remodeling projects may allow you to get more bang for your buck, such as a garage door replacement or installing stone veneer. To appeal to sustainable-minded buyers, consider these 5 Green Upgrades that Increase Your Home Value.

Selling Your Home As Is
Deciding not to remodel your home will come with its own pros and cons. By selling as is, you may sell your home for less, but you also won’t incur the cost and headache of dealing with a remodel. And since you’ve decided to sell, you won’t be able to enjoy the fruits of the remodel, anyway. If you sell your home without remodeling, you may forego the ability to pay down the costs of buying a new home with the extra money you would have made from making those upgrades.
Market Conditions: Home Remodel vs. Selling Your Home As Is
Local market conditions may influence your decision of whether to remodel before selling your home. If you live in a seller’s market, there will be high competition amongst buyers due to a lack of inventory. You may want to capitalize on the status of the market by selling before investing time in a remodel since prices are being driven up, anyway. If you take this approach, you’ll want to strategize with your agent, since your home may lack certain features that buyers can find in comparable listings. In a seller’s market, it is still important to make necessary repairs and to stage your home.
In a buyer’s market, there are more homes on the market than active buyers. If you live in a buyer’s market, you may be more inclined to remodel your home before selling to help it stand out amongst the competition.
Timing: Home Remodel vs. Selling Your Home As Is
Don’t forget that there is a third option: to wait. For all the number crunching and market analysis, it simply may not be the right time to sell your home. Knowing that you’ll sell your home at some point in the future—but not right now—will allow you to plan your remodeling projects with more time on your hands which could make it more financially feasible to complete them.
For more information on how you can prepare to sell your home, connect with one of our local agents—we’re always happy to chat about your situation and offer advice.
1©2021 Zonda Media, a Delaware corporation. Complete data from the 2021 Cost vs. Value Report can be downloaded free at www.costvsvalue.com.
This article originally appeared on the Windermere blog January 10, 2022. Written by: Sandy Dodge.
We earn the trust and loyalty of our brokers and clients by doing real estate exceptionally well. The leader in our market, we deliver client-focused service in an authentic, collaborative, and transparent manner and with the unmatched knowledge and expertise that comes from decades of experience.
© Copyright 2022, Windermere Real Estate/Mercer Island.
How’s the Market? Annual Report on Seattle Area Real Estate…
In the wake of extreme buyer demand and mind-blowing bidding wars, housing prices soared in Seattle and reached staggering heights on the Eastside. Record low interest rates were the silver lining for those buyers who were able to successfully purchase a home with financing.
2022 looks to be another strong year for real estate. Windermere’s chief economist, Matthew Gardner, predicts that interest rates will remain low and home price growth will continue—albeit at a slower, more sustainable rate than we saw in 2021. He also foresees a nice bounce back for our COVID-impacted economy in Q4 of 2022.
Click or scroll down to find your area report:
Seattle | Eastside | Mercer Island | Condos | Waterfront
SEATTLE
The Seattle real estate market, while extremely active in its own right, was far more moderate than the Eastside’s frenzied and nearly unattainable environment.
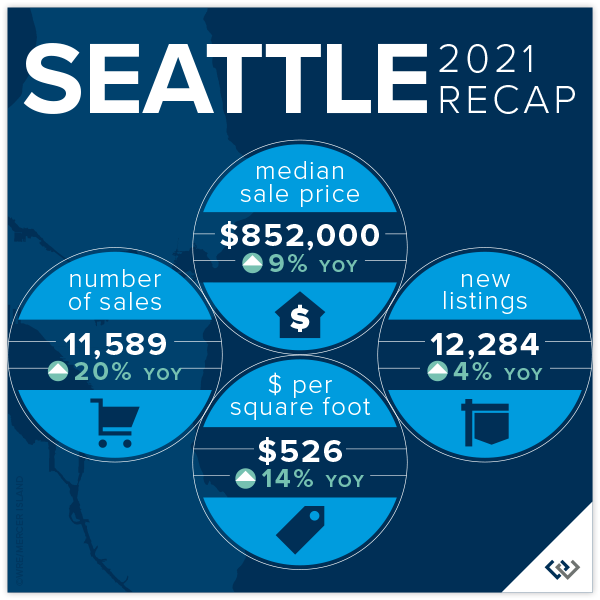
Seattle’s Median Sale Price increased by 9% to $852,000 (up from $785,000 in 2020). Neighborhoods in Lake Forest Park-Kenmore (+24%) and Shoreline (+16%) outperformed the average, while Queen Anne-Magnolia (+4%) and West Seattle (+7%) lagged behind.
Despite the tight supply of homes for sale, there was a 20% increase in the number of Seattle homes sold in 2021 (11,589) compared to 9,682 sold in 2020. Central Seattle (+31%) and Queen Anne-Magnolia (+22%) had the largest increases in number of homes sold.
79% of all Seattle homes, and 24% of those priced above $1 million, sold at or above the list price.
Homes that sold in their first ten days on the market went for an average of 7% above list price, compared to 4% over if we look at the overall average. The most competitive neighborhoods were North Seattle and Lake Forest Park, with first-ten-day sales averaging 10% above list price.
Click here for the full report and neighborhood-by-neighborhood statistics!

EASTSIDE
To say the 2021 Eastside real estate market was aggressive would be the understatement of the year. Typical home buyers requiring loans to finance their purchases found it nearly impossible to compete with the many cash or cash-equivalent, no contingency offers that often won out. With few exceptions, home buyers had to be willing to sacrifice rights and fail safes—such as inspection contingencies—that are normally taken for granted in a balanced market.
The Eastside’s Median Sale Price was $1,350,000 in 2021, up an unprecedented 32% over 2020 ($1,020,000) as desperately competing buyers drove prices to record levels. Redmond (+38%) and South Eastside (+36%) saw the largest gains, while West Bellevue (+25%) had the lowest—albeit still staggering—year-over-year increase.
89% of all Eastside homes, and 66% of homes priced above one million dollars, sold for at or above their list price. With fewer than 0.3 Months of Inventory (the number of months it would take to sell all homes currently for sale), the entire Eastside market remained ultra-competitive throughout the year. Many Eastside communities have had only a handful of homes for sale at any one time.
Homes sold an average of 7% above list price. For those sold within the first ten days, however, that number spiked to an average of 11% above list price. The most competitive neighborhoods were East Bellevue and South Eastside, with first—ten-day sales averaging 14% and 13% above list price, respectively.

Click here for the full report and neighborhood-by-neighborhood statistics!
MERCER ISLAND
Fewer than two dozen homes for sale on the Island at any given time in 2021 led to a continued ultra-competitive market. Waterfront, in particular, saw very steep increases during the year as the laws of supply and demand deftly governed prices.
Echoing the extreme price increases seen throughout the Eastside, Mercer Island’s Median Sale Price shot up by a staggering 29% over the last year. It’s worth noting, however, that this number was skewed upward by the unusually high number of luxury waterfront sales.
In 2021, 82% of all homes sold at or above their listed price. Those sold in the first 10 days on market closed for an average of 10% above their list price. On the other hand, homes on the market 11-30 days sold for an average of 2% below their list price list and homes on the market longer than 30 days sold for an average of 6% below their list price.

Click here for the full report and neighborhood-by-neighborhood statistics!
CONDOS – SEATTLE & EASTSIDE
Seattle condos saw a Median Sale Price increase of 2% (to $490,000) and Eastside condos saw a 5% increase (to $550,000) in 2021. 46% of Seattle condos and 67% of Eastside condos sold in the first ten days on the market.
60% of Seattle condos and 77% of Eastside condos sold at or above their listed price. Those sold in the first 10 days on the market went for an average of 2% and 5% above their list price, respectively.
On the Seattle side, Shoreline condos saw a 43% increase—and on the Eastside, Sammamish and Redmond condos saw a 20% increase—in Median Sale Price driven by both new construction and buyer demand. West Bellevue saw an 18% decrease due to the lack of significant new construction following the debut of luxury new construction in 2020.
Check out area-by-area details the full condo report.
WATERFRONT
There were 170 privately-owned waterfront home sales in the greater Seattle-Eastside region in 2021 (Eastside 59; Seattle 48; Lake Sammamish 36; Mercer Island 27).
The waterfront home market continues to see incredible buyer demand coupled with an extreme shortage of available waterfront homes for sale. As an indicator of demand in the luxury segment, most homes sold near to or above their list price with few outliers—something that historically has rarely happened in this sector.
This brief overview of the entire Seattle-Eastside private waterfront market, including Mercer Island and Lake Sammamish, illustrates the trends occurring in our region over time. This data is interesting and insightful but cannot replace an in-depth waterfront analysis provided by a savvy broker with years of local waterfront experience.
We earn the trust and loyalty of our brokers and clients by doing real estate exceptionally well. The leader in our market, we deliver client-focused service in an authentic, collaborative, and transparent manner and with the unmatched knowledge and expertise that comes from decades of experience.
2737 77th Ave SE, Mercer Island, WA 98040 | (206) 232-0446
mercerisland@windermere.com
© Copyright 2022, Windermere Real Estate/Mercer Island.
Holiday Happenings Around the Sound

Holiday shows are BACK for 2021 and ready to lift your spirits. Whether it’s meandering through a dazzling light show, watching the “snow” fall at Bellevue’s Snowflake Lane, or taking a holiday-themed cruise, there are so many ways to brighten up your Northwest holidays. Here’s the skinny on dates, times, food, parking, and safety requirements…
WildLanterns at Woodland Park Zoo
West Entrance: 5500 Phinney Ave. N, Seattle, WA 98103
South Entrance: 750 N 50th St, Seattle, WA 98103
www.zoo.org/wildlanterns
Click here to get tickets
- Dates/Times: Open nightly Nov. 12, 2021 – Jan. 30, 2022 | 4:00 – 8:30 pm.
- Cost: $25.95 – $30.95 per person (ages 2 and under are free).
- Promotions: Zoo members get 20% off tickets.
- Parking: $5 parking is available at all lots after 3:30 pm (admission at both gates).
- Food: Refreshments are available at food kiosks throughout, plus the Pizza Corner at 1899 Grove, and Gather & Graze (with covered seating provided). You are also welcome to bring your own food and non-alcoholic beverages.
- Special Activities: Tianyu Art Performances by the carousel, WildLights Trail through the Habitat Discovery Loop, & up-close Ambassador Animals at the Broadleaf Theater.
- Closures: Mondays (except for Dec. 20 & 27); Nov. 25, Dec. 24 & 25.
- Health & Safety: Proof of vaccination or negative COVID test required for ages 12+. Masks required for ages 5+.
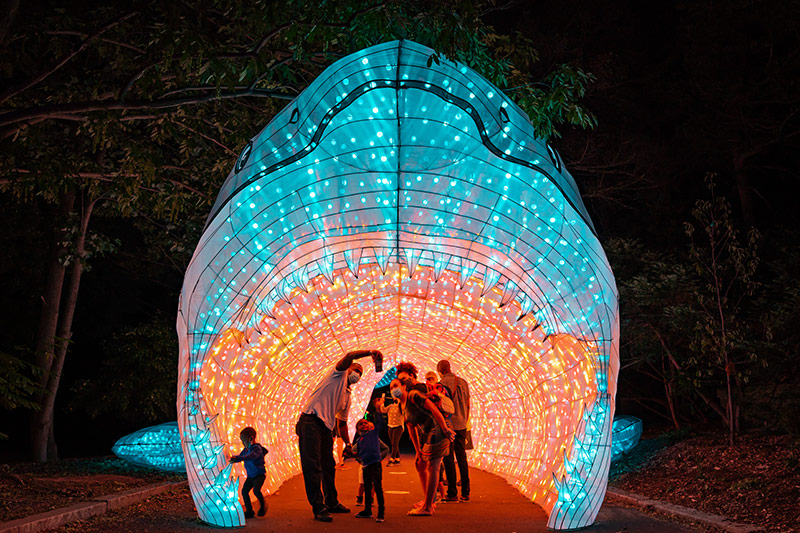
Image courtesy of zoo.org
Winterfest at Seattle Center
305 Harrison Street, Seattle, WA 98109
www.seattlecenter.com/winterfest
- Dates/Times: Nov. 26, 2021 – Dec. 31, 2021. Seattle Center Luminata with winter light & music display at International Fountain daily at 6pm; ice sculpting Nov. 27, Dec. 4, 11, & 18; Winter train & village open daily Nov. 26 – Dec. 31 | 10 am – 6 pm.
- Cost: Free for all ages.
- Parking: Paid parking available at the Mercer Garage, 5th Ave N Garage, and Theatre Commons ADA Lot. Click here for the campus map.
- Food: A multitude of dining options await you in the Armory.
- Special Events: Ice sculpting, live stage entertainment at the Armory, the Winter Train & Village, and more!
- Holiday Closure: Dec. 25
- Health & Safety: Masks required for ages 5+. For indoor spaces, proof of vaccination or negative COVID test required.

Image courtesy of seattlecenter.com
Garden d’Lights at Bellevue Botanical Garden
12001 Main Street, Bellevue WA 98005
http://gardendlights.org
click here to get tickets
- Dates/Times: Open nightly Nov. 27, 2021 – Dec. 31, 2021 | 4:30 – 9:00 pm
- Cost: $5 per person (ages 10 and under are free)
- Parking: Premium parking is $5 per car in the Garden’s lot (cash only) as space allows OR park for free at Wilburton Hill Park
- Food: Hot drinks and snacks are available on site
- Holiday Closures: None
- Health & Safety: For indoor spaces, masks required for ages 5+

Image courtesy of bellevuebotanical.org
Snowflake Lane at the Bellevue Collection
Bellevue Way & NE 8th Street, Bellevue WA 98004
http://snowflakelane.com/
- Dates/Times: Nightly Nov. 26, 2021 – Dec. 24, 2021 | 20 minute show starts at 7 pm
- Cost: Free for all ages
- Parking: Free parking at Bellevue Square, Bellevue Place and Lincoln Square
- Food: A variety of dining options (from happy hour, to kid fare, to gourmet) are all within walking distance
- Special Events & Activities: Ice Skating, Santa Photos
- Health & Safety: Masks requested for ages 5+
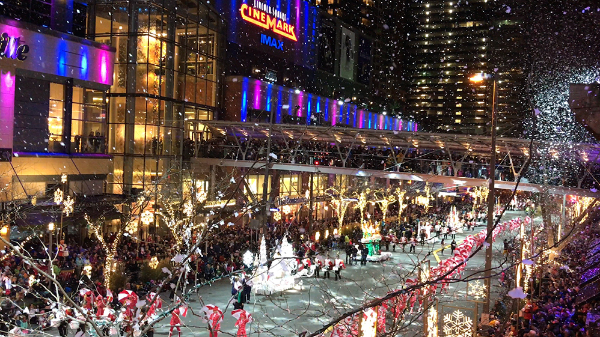
Image courtesy of snowflakelane.com
Christmas Ship Festival
Launch locations include Seattle Waterfront – Pier 55, Shilshole Bay Marina, Hyatt Regency Lake Washington, Lake Union Park, and Kirkland City Dock.
www.argosycruises.com
click here to get tickets
- Dates/Times: Click here for the full schedule
- Cost: $37 – $68 per person (kids 3 and under are free)
- Parking: Varies by location – click here for details
- Food: While dining ahead of time is recommended, there are snacks and drinks available for purchase on the ship. You can also pre-order FareStart Catering boxed meals, snacks and Ivar’s clam chowder (with vegetarian and gluten-free options) at least 72 hours prior to your cruise. Outside food/drinks are not allowed.
- Special Events: Opening Night, Parade of Boats, Grand Finale
- Health & Safety: Proof of vaccination or negative COVID test required for ages 12+. Masks required for ages 5+.
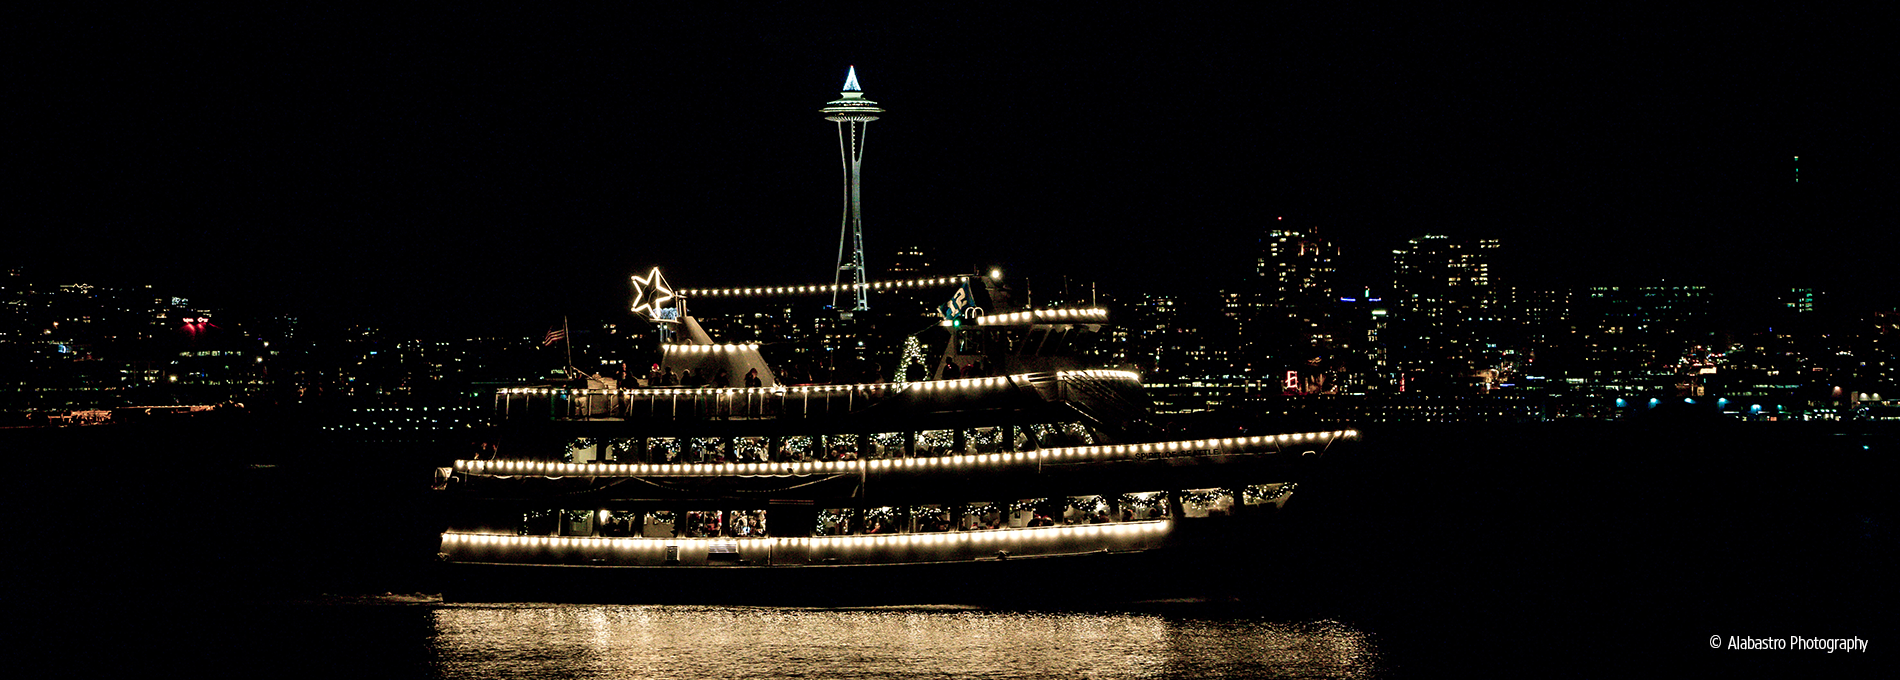
Image courtesy of argosycruises.com
Westlake Center Tree Lighting & Holiday Activities
401 Pine St., Seattle, WA 98101 (Westlake Park)
https://downtownseattle.org/events/holidays
- Tree Lighting Celebration: Evening of Nov. 26 in Westlake Park, time TBD (also streamed live on DSA’s Facebook page).
- Light Sculptures: Nov. 22, 2021 – Jan. 9, 2022 in Westlake Park & Occidental Square.
- Augmented Reality Adventure: Nov. 26, 2021 – Jan 10, 2022 around Westlake Park & Occidental Square.
- Pop-Up Sweets & Treats: Nov. 27, Dec. 4, 11 & 18 | 2-6 pm in Westlake Park.
- Holiday Concerts: Nov. 28, Dec. 5, 12 & 19 | 12-2 pm in Westlake Park.
- Happy Holidays Booths: Dec. 5, 12 & 19 | 11 am – 2 pm in Occidental Square.
- Cost: Free for all ages
- Parking: Access the Republic Parking garage from Olive Way between 4th & 5th Ave, or check out this interactive map of city parking
- Health & Safety: Masks requested for ages 5+
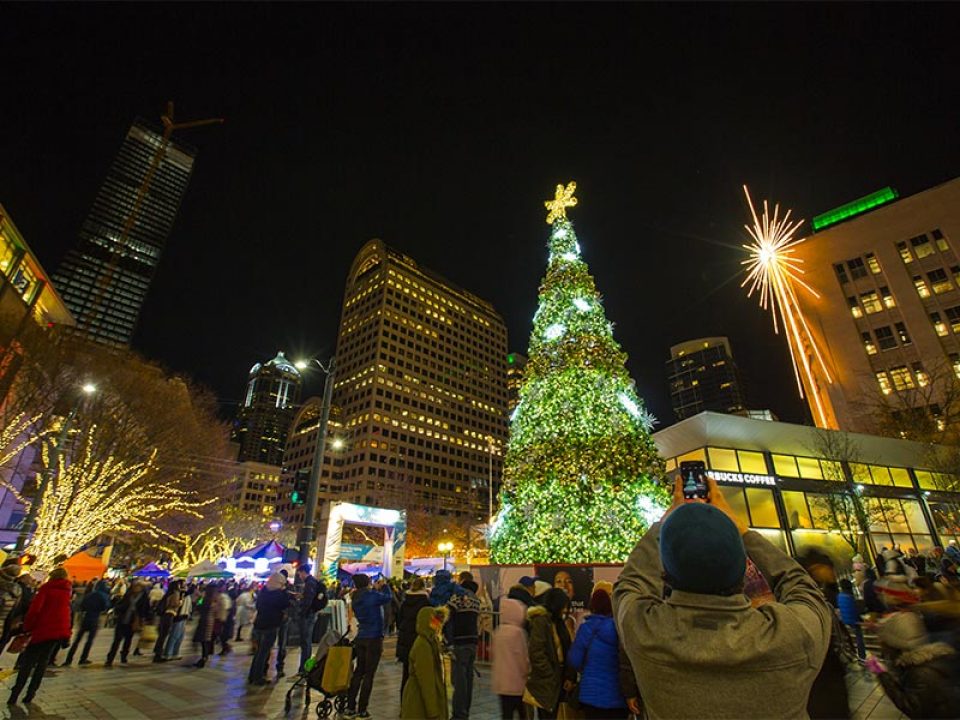
Image courtesy of downtownseattle.org
Zoolights at Point Defiance Zoo & Aquarium
5400 N Pearl St, Tacoma, WA 98407
www.pdza.org/event/zoolights
click here to get tickets
- Dates/Times: Open nightly Nov. 26, 2021 – Jan. 2, 2022 | 4:30 – 10 pm
- Cost: $12-$15 (free for kids 2 & under)
- Promotions: Discounted tickets for zoo members & BECU members
- Parking: Free parking in zoo lots (carpooling recommended)
- Food: Dinner, drinks & snacks to-go are available at the Plaza Cafe & outside stands
- Activities: Carousel, Kids’ Zone with meerkats & goat feeding
- Holiday Closures: Dec. 24 & 25
- Health & Safety: Masks required for ages 5+
Image courtesy of https://www.pdza.org
But wait, there’s more…
Holiday theatrical & musical shows
“A Christmas Carol” at ACT Theatre
“The Nutracker” by Pacific Northwest Ballet
The Polar Express train ride at Mt. Rainier Railroad
Gingerbread Village at the Sheraton Grand Seattle
We earn the trust and loyalty of our brokers and clients by doing real estate exceptionally well. The leader in our market, we deliver client-focused service in an authentic, collaborative, and transparent manner and with the unmatched knowledge and expertise that comes from decades of experience.
2737 77th Ave SE, Mercer Island, WA 98040 | (206) 232-0446
mercerisland@windermere.com
© Copyright 2021, Windermere Real Estate/Mercer Island.
Give Back This Season

“We make a living by what we get; we make a life by what we give.”
Giving to others can enrich our own lives in ways we never imagined. With that in mind, here are some of our favorite Seattle-area organizations who are in need of time, resources, toys, and more to help improve the lives of homeless and low-income families in our area. You might also check out these tips on how to make the most of charitable giving. Together we can make the holidays a little brighter for everyone!

Each night in King County, almost 1,100 unaccompanied youth and young adults experience homelessness on any given night, and around 70% of these youth sleep outside because of lack of shelter or housing. Why? A national study found that over 90% of homeless youth reported family conflict and 1/4 suffered from abuse and neglect before they reached the streets. YouthCare builds confidence and self-sufficiency for homeless youth by providing a continuum of care that includes outreach, basic services, emergency shelter, housing, counseling, education, and employment training. Lend a hand by donating most needed items, delivering a warm meal, hosting a virtual fundraiser, or hiring a YouthCare graduate.
http://youthcare.org/
(206) 694-4500
2500 NE 54th Street, Seattle
![]()
Northwest Harvest’s mission is to end hunger in Washington. They partner with 375 food pantries, meal programs, and high-need schools across the state to provide nutritious food (an average of 2 million meals per month!) and promote good health for those in need. You can help by hosting a virtual food drive, making a cash donation, or volunteering (children age 9 and up can volunteer with you!).
http://www.northwestharvest.org/
1 (800) 722-6924
SODO Community Market Food Bank: 1915 4th Ave S, Seattle
Kent Warehouse: 22220 68th Ave S, Kent

Mary’s Place helps homeless women, children and families from the greater King County area. You can help by participating in their giving tree tag program now through December 11th. You can also volunteer your time, donate wishlist items, or share your used clothing, blankets, and coats.
http://www.marysplaceseattle.org
(206) 621-8474
Donation Center in SODO: 9 South Nevada St, Seattle
Mary’s Place at the Regrade: 720 Blanchard St, Seattle
![]()
Hopelink provides critical services to homeless and low-income families, children, seniors, and people with disabilities on north and east King County. You can help by donating to their Greatest Needs Fund, volunteering at one of their centers, participating in their Turkey Trot 5k fundraiser (virtual this year), or making a cash donation to support their “Lend a Hoping Hand” holiday giving campaign.
https://www.hopelink.org/
(425) 869-6000
8990 154th Ave NE, Redmond

Did you know less than 50% of Washington state youth in foster care graduate from high school? Treehouse seeks to level the playing field by providing academic and other essential support foster kids need to graduate at the same rate as their peers, with a plan for their future. You can help by hosting a holiday drive, purchasing items on their holiday wish list, volunteering, or donating.
https://www.treehouseforkids.org/
(206) 767-7000
2100 24th Avenue S./Suite 200

With a mission to help people in need of immediate food assistance, the Emergency Feeding Program partners with 120 local agencies to distribute 42,000 meals of quality, nutritional food per week and ensure that no one will go hungry tonight. Your volunteer time or cash contribution would be most appreciated.
https://www.emergencyfeeding.org/
(425) 277-0300
851 Houser Way N, Suite A, Renton
![]()
Eastside Baby Corner was founded by a local pediatric nurse concerned about the large numbers of babies in her practice who began life without basic essentials like adequate food, clothing, beds, or safety equipment. Today Eastside Baby Corner’s locations in Issaquah, Northshore and Bremerton collect, purchase, and distribute essential care items such as formula, diapers, car seats, warm coats, school supplies, and more for babies and children in need. You can help out by donating goods or cash, shopping off their wish list, volunteering or organizing a drive.
Eastside Baby Corner:
http://babycorner.org
(425) 865-0234
1510 NW Maple St, Issaquah
![]()
Last year, King County Toys for Tots donated 85,169 toys to 61,092 local children in need. Consider helping out this year by making a cash donation, donating a toy before December 15th, hosting a Toys for Tots event, or asking your organization to become a toy drop site.
https://fort-lewis-wa.toysfortots.org
Coordinator: GySgt Edward Chapman, 760-405-3203

Every year, nearly 40% of our country’s food ends up in landfills, while millions go hungry. Food Lifeline attempts to solve both problems by rescuing millions of pounds of surplus food from farmers, manufacturers, grocery stores, and restaurants. They then deliver this healthy and nutritious food to more than 350 food banks, shelters and meal programs across Western Washington–providing the equivalent of 201,000+ meals every day for hungry children, adults and seniors. You can help by volunteering (opportunities are available for kids as young as 10, too!), donating funds or hosting a food drive.
https://foodlifeline.org/
(206) 545-6600
815 S 96th St, Seattle
![]()
Wellspring helps low-income and vulnerable individuals, children and families in Seattle and King County address issues such as mental health, family homelessness, early learning, basic needs, and domestic violence intervention. Each year they help thousands of children and families break cycles of instability, homelessness, and adversity to achieve positive, permanent change. You can help by donating essential items, cash, or your old vehicle. You can also get your kids involved in the Kids Helping Kids youth philanthropy program.
http://wellspringfs.org/
(206) 826-3050
1900 Rainier Avenue South, Seattle
![]()
Founded and run by a group of philanthropic women over 100 years ago, Seattle Children’s mission is to provide hope, care and cures to help every child live the healthiest and most fulfilling life possible. You can help their patients by donating a new toy or gift card, volunteering, contributing funds, or supporting one of its guilds (such as the Project Kids Cancer Cure Guild).
http://www.seattlechildrens.org
(206) 987-2000
4800 Sand Point Way NE, Seattle
We earn the trust and loyalty of our brokers and clients by doing real estate exceptionally well. The leader in our market, we deliver client-focused service in an authentic, collaborative, and transparent manner and with the unmatched knowledge and expertise that comes from decades of experience.
© Copyright 2021, Windermere Real Estate/Mercer Island.
How’s the Market? Q3 Real Estate Review

The frenetic pace of Seattle-area real estate continued in Q3, with the number of sales and median sales prices both up across the region compared to this time last year. Seattle condo sales saw a healthy year-over-year jump as they continued to recover from the COVID slump we saw in 2020.
While buyers still contended with a lack of inventory and stiff competition for available homes, our continued low interest rates were the silver lining. Those obtaining financing were buoyed up by lower mortgage payments and increased buying power compared to times when rates are higher.
Click or scroll down to find your area report:
Seattle | Eastside | Mercer Island | Condos | Waterfront
SEATTLE
Seattle’s Median Sale Price increased by 8% to $865,500 (up from $800,000 in Q3 2020). Neighborhoods in Lake Forest Park-Kenmore (+19%), Shoreline (+13%), North Seattle (+10%), West Seattle (+10%), and Queen Anne-Magnolia (+9%) outperformed the average while South Seattle (+8%) stayed on par and Ballard-Green Lake (+5%) and Central Seattle (+2%) lagged behind.
There was an 8% increase in the number of Seattle homes sold in the third quarter of 2021 (3171) compared to Q3 2020 (2929) despite the tight supply of homes for sale. Central Seattle (+20%) and North Seattle (+18%) had the largest increases over Q3 2020 in number of homes sold.
79% of all Seattle homes, and 28% of those priced above $1 million, sold at or above the list price. The average of all homes sold closed at a price 4% more than list. Price increases were even more dramatic when homes sold in their first ten days on the market—with an average sale price of 7% above list price. The most competitive neighborhoods were North Seattle and South Seattle, with first 10-day sales averaging 9% and 8% above list price, respectively.

Click here for the full report and neighborhood-by-neighborhood statistics!
EASTSIDE
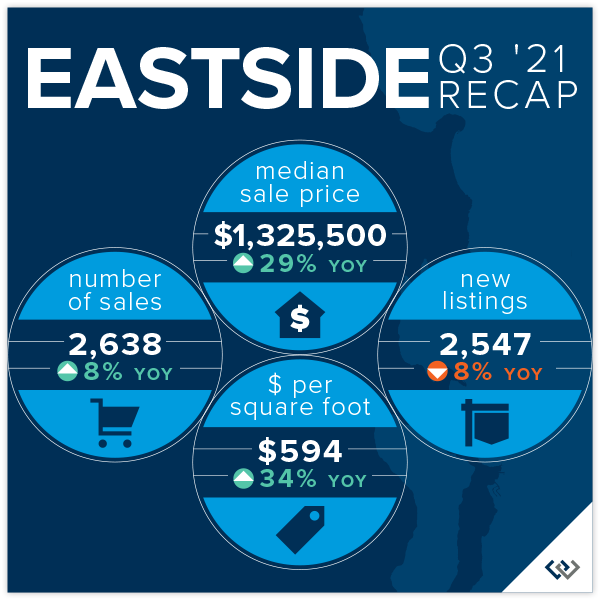
The Eastside’s Median Sale Price was $1,325,500 in the third quarter of 2021, up 29% over Q3 2020 ($1,025,100). Buyer demand outpacing the supply of homes for sale was the biggest factor fueling this increase. Mercer Island, (+42%), Redmond (+32%), Sammamish (+32%), and South Eastside (+32%) saw the largest gains, while Woodinville (+23%) had the smallest year-over-year increase.
87% of all Eastside homes, and 65% of homes priced above one million dollars, sold for at or above their list price. With 59% fewer homes for sale than in Q3 2020, the entire Eastside market remained ultra-competitive. The average of all homes sold was 7% above list price. Homes sold within the first ten days went for an average of 11% above list price. The most competitive neighborhoods were East Bellevue and South Eastside, with first 10-day sales averaging 13% and 12% above list price, respectively.
The Eastside market saw Months of Inventory (the number of months it would take to sell all homes currently for sale) remain at historical lows of between 0.3 and 0.4 months. Many Eastside communities have had only a handful of homes for sale at any one time.
Click here for the full report and neighborhood-by-neighborhood statistics!

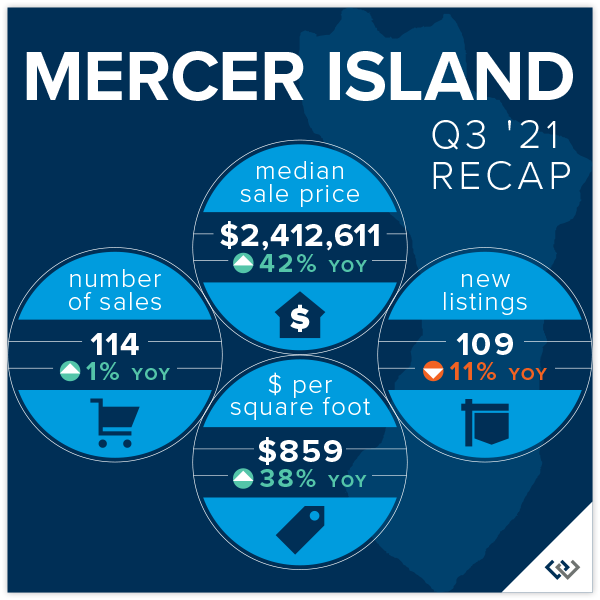
MERCER ISLAND
Fewer than two dozen homes for sale on the Island at any given time has led to a continued ultra-competitive market and unpredictable shifts in median sale price as a result. It’s worth noting that a few very high-end waterfront home sales skewed the median sale price upward as compared to last year.
In the third quarter of 2021, 75% of all homes sold at or above their listed price. Sellers who prepped and priced their homes competitively reaped huge rewards from bidding wars—those that sold in the first 10 days on market closed for an average of 10% above their list price.
On the other hand, those properties that were not immediately snapped up tended to sell at a discount. Homes on the market 11-30 days sold for an average of 3% below their list price, while homes on the market longer than 30 days sold for an average of 5% below their list price. Pricing and condition tended to separate the “haves” from the “have nots” when it came to selling quickly.
Click here for the full report and neighborhood-by-neighborhood statistics!
CONDOS – SEATTLE & EASTSIDE
Condos did quite well overall in the third quarter of 2021 as single-family home markets became more competitive, and in some cases, unattainable.
Seattle condos saw a 3% increase (to $492,750) and Eastside condos saw a 10% increase (to $551,619) in Median Sale Price compared to Q3 2020.
62% of Seattle condos and 78% of Eastside condos sold at or above their listed price. Those sold in the first 10 days on the market went for an average of 2% and 5% above their list price, respectively.
Check out area-by-area details the full condo report.

WATERFRONT
The waterfront home market continues to see incredible buyer demand while also suffering from an extreme shortage of available homes for sale. Nearly every waterfront home listed for sale sold in record time, some for jaw-dropping prices. The Eastside had 23 waterfront home sales in the third quarter of 2021 while Seattle had 22 Q3 waterfront sales, Mercer Island had 15, and Lake Sammamish had 10 waterfront sales. More than half of waterfront homes listed for sale went under contract in mere days, with an average market time still a fraction of that of a more typical year.
As an indicator of demand in the luxury segment, with few outliers, most homes sold near to or above their list price—something that historically has rarely happened in this sector.
This brief overview of the entire Seattle-Eastside private waterfront market, including Mercer Island and Lake Sammamish, illustrates the trends occurring in our region over time. This data is interesting and insightful but cannot replace an in-depth waterfront analysis provided by a savvy broker with years of local waterfront experience.
We earn the trust and loyalty of our brokers and clients by doing real estate exceptionally well. The leader in our market, we deliver client-focused service in an authentic, collaborative, and transparent manner and with the unmatched knowledge and expertise that comes from decades of experience.
© Copyright 2021 Windermere Mercer Island
2021 Football Schedules, Recipes & Tips…

Are you ready for some football? Fall is just around the corner and tickets are on sale now for 12s who are itching to get back to the stadium (operating at full capacity this season but with enhanced safety protocols).
Watching the game from the comfort of home? Check out these great tips on setting up the ultimate media room from The Spruce, along with our favorite gameday recipes.


We earn the trust and loyalty of our brokers and clients by doing real estate exceptionally well. The leader in our market, we deliver client-focused service in an authentic, collaborative, and transparent manner and with the unmatched knowledge and expertise that comes from decades of experience.
2737 77th Ave SE, Mercer Island, WA 98040 | (206) 232-0446
mercerisland@windermere.com
© Copyright 2021 Windermere Mercer Island


