 Facebook
 Twitter
 Pinterest
 Copy Link
Payback times for energy-efficient home upgrades

Thinking of going green? Today’s technology offers a whole host of ways to boost your home’s efficiency, reduce your carbon footprint and lower your energy bills. Some upgrades can pay for themselves in a relatively short amount of time, while others with large price tags might take decades to start paying back. The good news is that several studies have shown buyers are willing to pay a premium for green features—as much as 30% more for retrofitted green homes that become Energy Star or LEED-certified. This means that even if those fancy new features don’t pay you back right away in energy savings, you might still be able to recoup part of the cost when you sell your home. Below are the average payback times for some common items…just keep in mind that the actual payback time will depend on your initial costs and the amount of energy you typically use each month.

According to EnergySage.com, the average cost for adding solar panels to your home in King County is about $13,850 for a typical 5kW system (a net cost of $10,249 after the 26% Federal Investment Tax Credit for 2020). Based on the amount of energy they generate in our area, they usually pay for themselves in about 10.16 years. Furthermore, a study commissioned by the Department of Energy found that home buyers across multiple states and home types were willing to pay more for homes with solar panels (about $15,000 for homes with a 3.6kW system). This may help offset your costs should you need to sell your home before the payback period.

In addition to giving you endless hot water, tankless water heaters are also about 20% more energy efficient than traditional storage tanks and last about 10 years longer. However, their additional equipment and installation cost means it can take quite a while for your energy savings to cover that difference—12-20 years for electric models and 22.5-27.5 years for gas models. Their longer lifespan may ultimately help them pay off in the long run.

Looking for an easy investment with quick bang for your buck? LED bulbs may cost more, but the amount of electricity they save more than covers the cost. A 100W equivalent LED bulb costs about $6 to buy but uses only 13% the amount of energy of its incandescent counterpart. Used 4 hours a day, it also reduces CO2 emissions by a whopping 262.93 pounds per year. Depending on the number of bulbs you have and the frequency of their use, the dollar and carbon savings could really add up over time.

Our Seattle area’s temperate climate makes it a prime candidate for heat pump heating/cooling systems. Your actual savings and payback time will depend on the type of system you choose and the amount of energy you use. According to the US Department of Energy, an air source heat pump can reduce your electricity use for heating by about 50%, while the reduction range for a geothermal heat pump is anywhere from 30%-60%. If you’re also replacing an A/C unit, the savings will add up even faster. The average installed cost in 2020 is about $5,613 nationally but can vary quite a bit; it pays to do your research and make sure you’re choosing the right unit for your needs. Boosting your home’s overall efficiency first can also increase your savings by allowing you to choose a smaller, more affordable unit.

A feature of most modern green homes, smart thermostats save energy by automatically turning off the heating and A/C when you leave and learning your schedule to comfortably boost efficiency. Nest estimates an average yearly energy savings of 10-15% or $131-$145 with its Learning Thermostat, which means it would pay back its $200-$250 price tag in under 2 years. The ecobee4 is pricier at $300-$400 but claims to save 23% on heating and cooling (or more if you use their free eco+ upgrade). With heating and cooling making up a large chunk of your household energy use, smart thermostats could potentially take a nice chunk out of your carbon footprint as well.

Find a Home | Sell Your Home | Property Research
Neighborhoods | Market Reports | Our Team
We earn the trust and loyalty of our brokers and clients by doing real estate exceptionally well. The leader in our market, we deliver client-focused service in an authentic, collaborative and transparent manner and with the unmatched knowledge and expertise that comes from decades of experience.
2737 77th Ave SE, Mercer Island, WA 98040 | (206) 232-0446
© Copyright 2020, Windermere Real Estate / Mercer Island
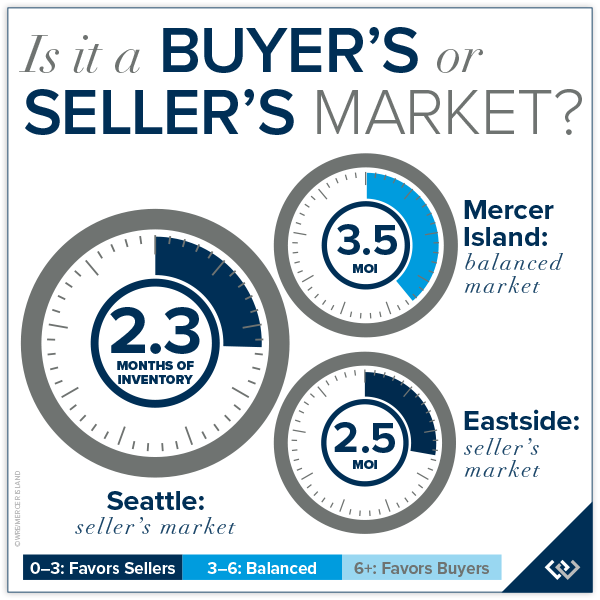
Q3 2019 Reports: Market Update


Q3 was the most stable and balanced market we have seen in years. With very low mortgage interest rates compelling buyers to act and fewer homes for sale than we saw last fall (when a flood of homes came to market), buyers and sellers are each finding their own place in a more equitable real estate arena.
Approximately 41% of homes for sale in Q3 sold at or above their listed price. This segment was on the market for an average of just seven days and included the most highly desired and well-priced properties in mainstream price points. Of the remaining homes for sale, just over one third underwent a price reduction before resulting in a sale. That number increased steadily as we moved deeper into Q3, ending the quarter with an average of 43% of listed homes with sales occurring following a price reduction.
From a home buyer’s perspective, the best properties sold quickly and at a premium. Of the homes that remained on the market, there was ample room for negotiation to a fair price. Q3 home sellers were generally more informed and more likely to price realistically from the start and adjust quickly if they were off target.
This more balanced market afforded many more consumers the ability to comfortably complete a sell/buy transaction and with enough time and space to thoroughly conduct due diligence on prospective properties.
Click or scroll down to find your area report:
Seattle | Eastside | Mercer Island | Condos | Waterfront
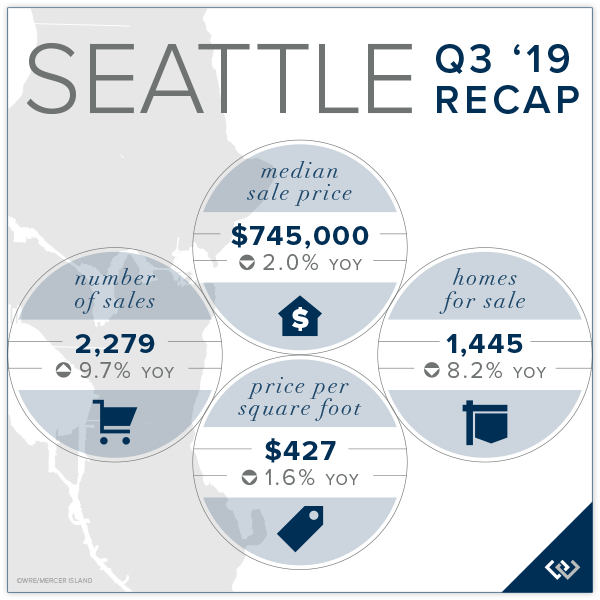
SEATTLE
The Seattle in-city real estate market slowed from a racetrack inferno to cruising speed over the past year and a half. Prices softened an average of 2% in Q3 with the Central Seattle region feeling the biggest impact (down 7.6% from Q3 2018). The Ballard-Green Lake region had the highest number of Q3 sales (582) while the Lake Forest Park-Kenmore area boasted the most affordable cost per home square foot ($340). When it comes to returns, Lake Forest Park-Kenmore, South Seattle, and Richmond Beach-Shoreline were nearly tied for the strongest five-year growth trend at 73.9%, 73.3% and 73.2% respectively.
Click here to view the complete report for a neighborhood by neighborhood breakdown of Average Sale Price, size, and number of homes sold.

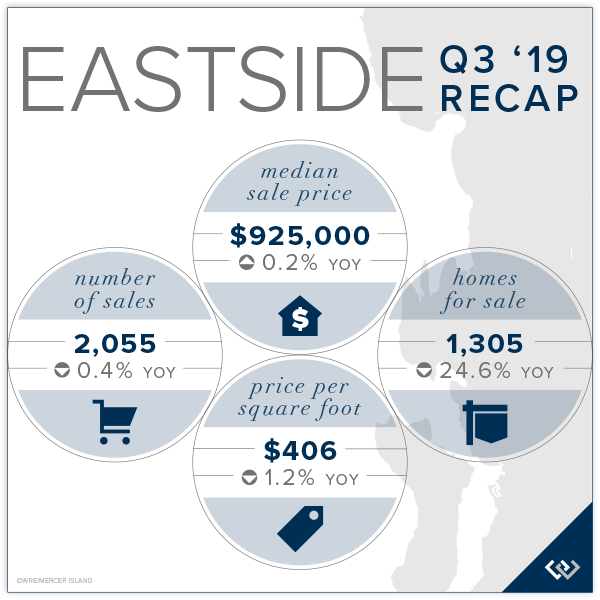
EASTSIDE
Stimulated by announced expansion from the top names in tech, the Eastside is the place to be right now. Buyers found far fewer homes for sale—nearly 25% less—in Q3 than they did just one year ago. Sale prices in Kirkland, bolstered by recent announcements from Google and Tableau, were up an average of 15.4% over Q3 2018. Prices near the Microsoft campus, where the Spring District is coming online, where up 3.2%. The West Bellevue market saw a lower Median Sale Price which was attributable to fewer high-end sales in Q3 this year compared to last year. All in all, the Eastside had a very good quarter. Home sellers should be pleased with their returns and home buyers should feel good about purchasing in a robust market.
Click here for the full report and neighborhood-by-neighborhood statistics!

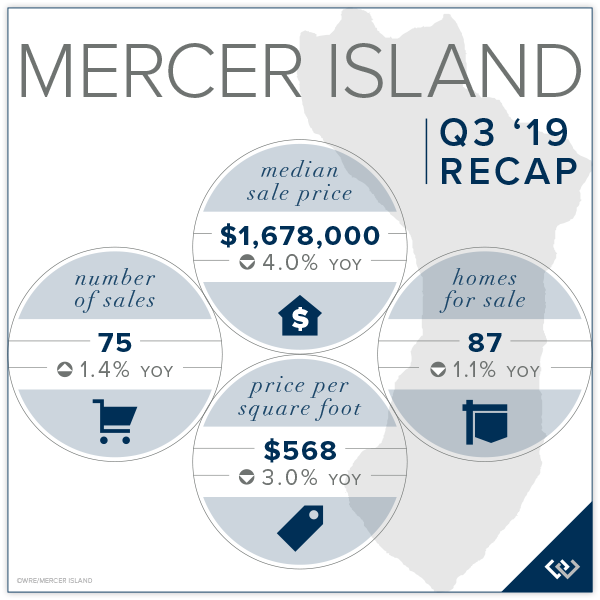
MERCER ISLAND
Mercer Island experienced continued slowing in the luxury market with fewer waterfront sales (5) than typical in Q3. Conversely, many moderately-priced renovation-ready homes transacted this quarter bringing the overall Q3 Median Sale Price down 4% to $1,678,000. The Island is finally beginning to see a moderate number of building and remodel applications submitted after a two-year lull sparked by major changes in the city’s residential building code. The North End had the highest average cost per square foot ($620) while Mercerdale ($435) was most affordable. First Hill had the shortest average market time with just 5 days and East Mercer had the longest (117 days). Demand remains steady and we expect well-priced, turnkey condition homes to continue to do quite well as we move further into the fall market.
Click here to view the complete report for a neighborhood by neighborhood breakdown of Average Sale Price, size, and number of homes sold.

CONDOS – SEATTLE & EASTSIDE
Competition from new and pre-sale buildings, aging structures, a larger percentage of affordable units transacting, and urban flight have contributed to the 12.3% Median Sale Price decline in Seattle to $438,500 (from $500,000 in Q3 2018). To be fair, the Five-Year Median Price Trend shows prices up 71.9% since Q3 2014, giving most condo owners a nice cushion to fall back on.
The Median Sale Price was down 1.9% on the Eastside to $471,000 from $480,000. An extremely low number of resale units for sale, coupled with many of the same attributes impacting the Seattle condo market, contributed to the slight softening seen in the Eastside condo market.
Recent changes in Washington condo laws will eventually bring more condos and townhomes online in the next economic cycle, but potential buyers may have to wait 5-7 years to see that morph from concept to reality.
Check out all of these factoids and more in the full condo report.

WATERFRONT
Seattle had 13 private waterfront home sales in Q3, the highest of which was a $10.6 million Laurelhurst estate on a shy acre with 150 feet on the water. The Eastside (Bellevue-Kirkland) had nine sales in Q3, including a $15.4 million 1925-built Yarrow Point home on 1.15 acres with 100 feet along the water’s edge. Further east, Lake Sammamish had eleven waterfront sales in Q3 ranging from $2.0-4.5 million.
Centrally located to the Seattle-Bellevue metro areas, Mercer Island had five private waterfront sales ranging from a $10.1 million, 2002-built North End home with 124 feet of waterfront on one and a half acres to a $3.6 million, mid-century Eastside home with 85 feet on the water and just over half an acre.
This top-level overview of the entire Seattle-Eastside private waterfront market, including Mercer Island and Lake Sammamish, provides a glance into the trends occurring in our region over time. Interesting, and certainly insightful, it in no way replaces an in-depth analysis on waterfront value provided by a savvy broker with years of local waterfront experience.

ABOUT WINDERMERE MERCER ISLAND
We earn the trust and loyalty of our brokers and clients by doing real estate exceptionally well. The leader in our market, we deliver client-focused service in an authentic, collaborative and transparent manner and with the unmatched knowledge and expertise that comes from decades of experience.

© Copyright 2019, Windermere Real Estate/Mercer Island. Information and statistics derived from Northwest Multiple Listing Service and deemed accurate but not guaranteed.


